Desklog tracks time automatically in the background and breaks it down into clearly defined metrics.
The time metrics work together to give a complete, accurate picture of user activity, productivity, and work patterns throughout the day.
At Work
At Work represents the total duration a user is logged into the system during their workday. It includes everything from the moment they start (clock in) until they finish (clock out), covering both active working time and inactive periods. This metric helps measure overall presence and availability.
Focus
Focus indicates how consistently a user stays engaged in work during their logged-in time. It is calculated as a percentage by comparing productive time against total time at work. A higher focus percentage means the user spends more time actively working rather than being idle or distracted.
Productive
Productive time is the actual time spent working. Desklog identifies this based on real-time system activity such as keyboard typing and mouse movement. Only periods with consistent activity are considered productive, making this a reliable measure of actual effort.
Task Spent
Task Spent shows how much time is used to complete assigned tasks. It reflects the real effort put into task execution and helps compare estimated time with actual time taken. This is useful for tracking efficiency and improving task planning.
Clock In
Clock In records the exact time a user begins their workday. This can happen when the user logs into the system or starts tracking. It marks the starting point for all time calculations.
Clock Out
Clock Out records when the user ends their workday or stops tracking. It marks the end of the work session and finalizes the total time recorded for that day.
Task Assigned
Task Assigned refers to the planned or allocated time given for completing tasks. It sets expectations for how long a task should take and helps in comparing planned effort versus actual time spent.
Minimum Hours
Minimum Hours defines the required number of working hours a user is expected to complete in a day. This value is set by the organization and is used as a baseline to measure attendance and performance.
Neutral
Neutral time includes apps or websites that are neither clearly productive nor distracting. These are typically tools that don’t directly contribute to measurable output but are still part of regular work usage. Neutral time is tracked but does not heavily impact productivity scoring.
Non-Productive
Non-Productive time is the duration spent on apps or websites that are not related to work activities. Desklog identifies and categorizes this time to highlight potential distractions and help users improve focus.
Over Time
Over Time is the additional time worked beyond the defined minimum hours. It reflects extended work effort and helps track extra hours spent on tasks or projects beyond regular schedules.
By combining all these metrics, Desklog provides a detailed and structured view of how time is spent, from when a user starts working, how actively they work, what they work on, and how their time aligns with expected work hours.
All tracked metrics are consolidated within the Desklog dashboard and related sections, enabling users to view, analyze, and interpret work data in a unified interface. These sections include:
1. Desklog Dashboard
When you log into Desklog, the first screen you see is your Desklog dashboard, designed to give you a complete overview of your team’s productivity while supporting a healthy work-life balance. The dashboard provides all relevant data about users, and you can filter this information based on your preferences, whether by the entire team, specific teams, or individual members. This flexibility helps both managers and employees gain meaningful insights into work patterns and performance trends.
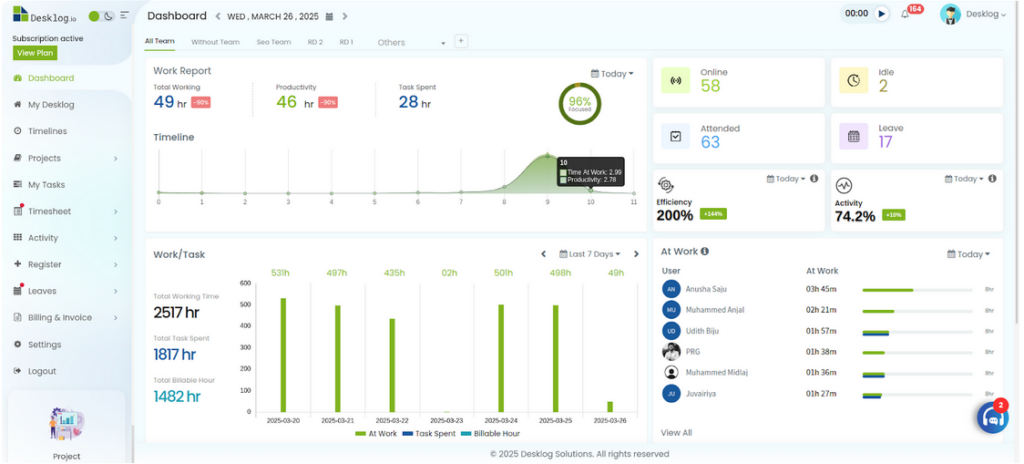
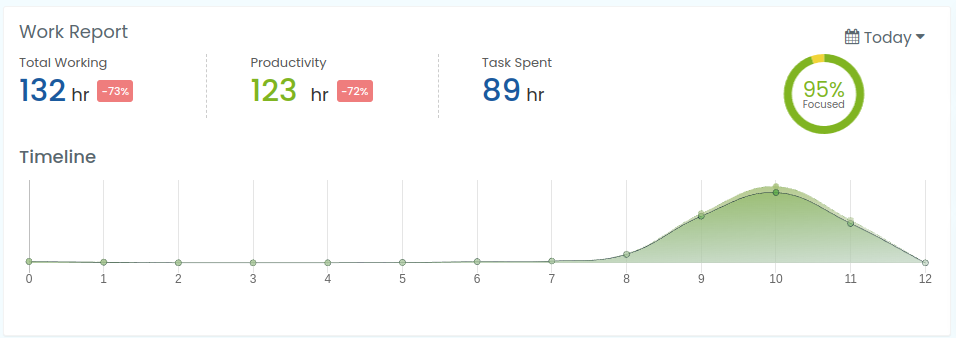
2. Work Analytics: Insights That Empower
The Work Analytics section provides detailed insights into your team’s performance. Here, you can view:
- Total Working Hours – Understand how much time your team spends at work.
- Productivity Hours – Track the time actively spent on tasks.
- Task Time – See the total duration spent on completing assigned tasks.
- Focus Percentage – Get an overview of overall team efficiency.
These metrics are designed not only for managerial insight but also to help employees self-regulate, identify productive habits, and avoid burnout.
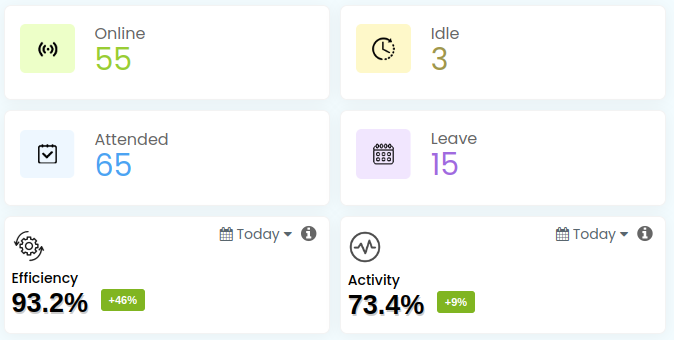
3. User Status & Engagement Overview
On the right-hand side of the dashboard, you’ll find the user count, showing the status of each team member:
- Online
- Idle
- Present
- On Leave
Below this, the Efficiency Rate and Activity Rate provide a snapshot of overall team engagement. These insights allow managers to support employees effectively while fostering autonomy and transparency.
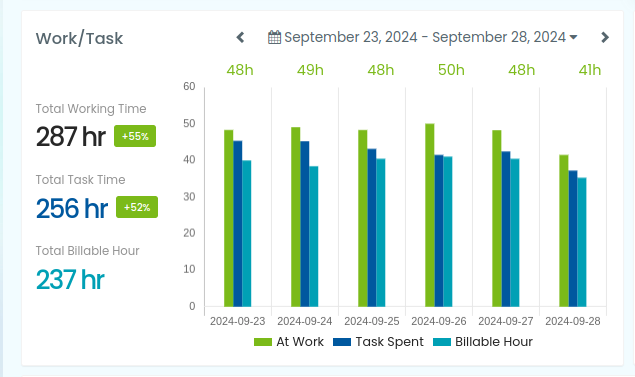
4. Visualizing Productivity Trends
Scroll down to see work hours graph for the selected time period, comparing:
- Total working time
- Time spent on tasks
- Total billable hours
This visual representation makes it easy to track trends over time, identify bottlenecks, and encourage a balanced workflow.

Alongside this graph, individual user timelines show personal work and billable hours, helping both managers and employees track progress and plan tasks efficiently.

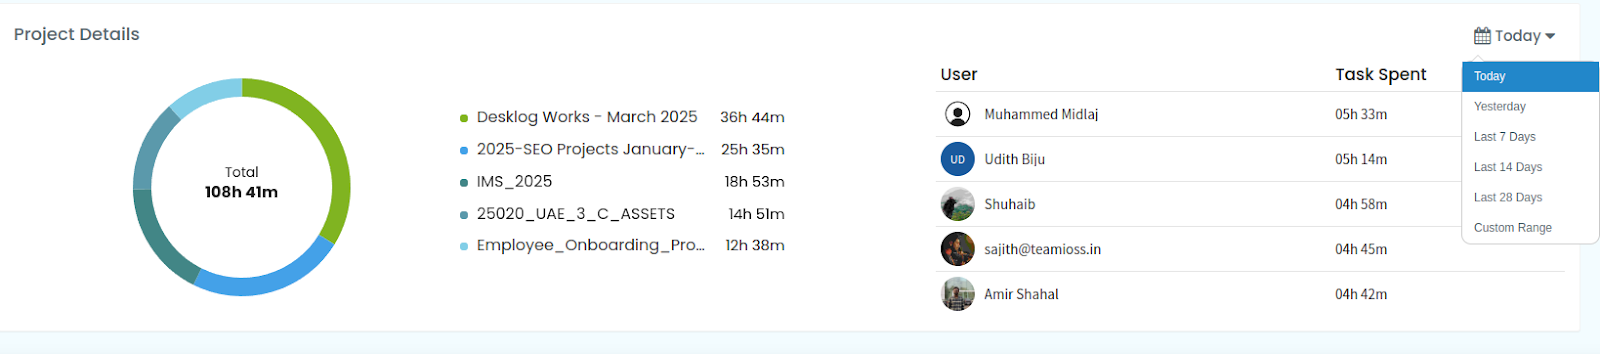
5. Project Insights
The Project Details section breaks down time spent across projects:
- Pie charts show the total time dedicated to each project.
- A list of project names with corresponding hours lets you see how effort is distributed.
- Individual contributions are highlighted, showing each user’s time spent on specific projects.
All project data can be filtered using the calendar button on the right side to focus on a specific date range.
6. Understanding Time at Work vs. Productive Time
Desklog tracks multiple metrics to help users understand their workflow:
- Clock In/Clock Out – Track arrival and exit times, or “online” if logged in.
- Time at Work – Total time in the workplace, including both productive and non-productive periods.
- Productive Time – Time actively spent working on tasks; idle periods are excluded.
- Idle Time – Time away from the keyboard or mouse.
- Offline Time – Time spent without an internet connection.
- Private Time – Time when logged out.
Tasks Spent – Total time spent completing tasks.
7. Difference Between Time at Work and Productive Time
- Time at Work = All hours tracked in the system (both productive and non-productive).
- Productive Time = Hours actively engaged in tasks, excluding idle time.
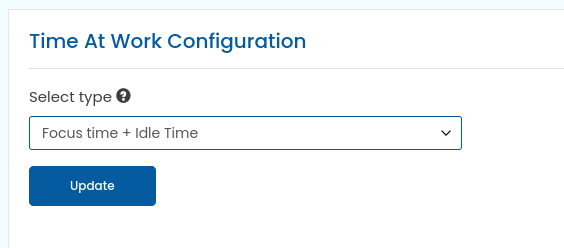
Admins can configure these definitions from the settings panel.
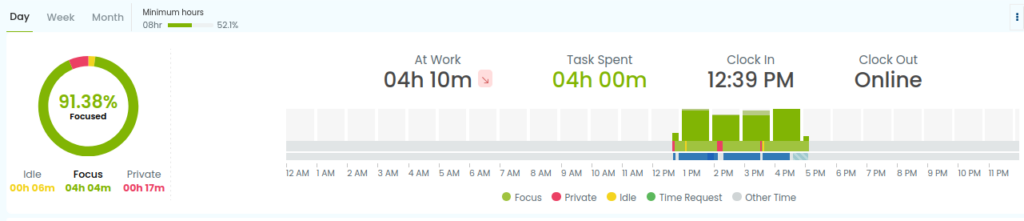
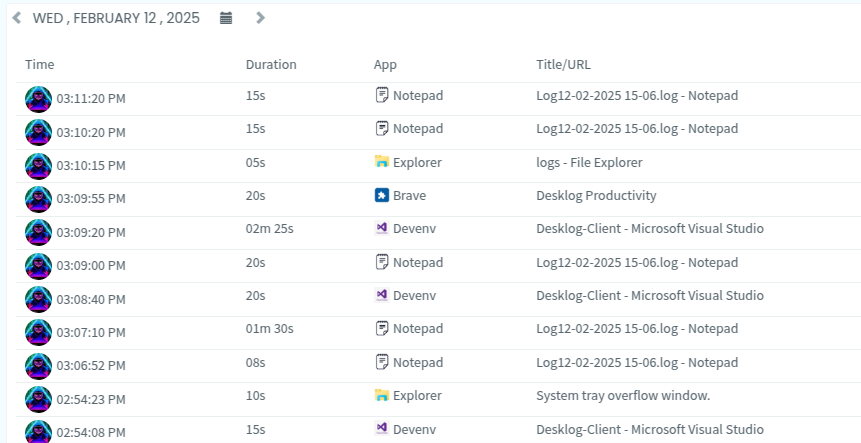
8. User Dashboard Details
The User Dashboard provides multiple visual tools to track performance and workflow:
- Work Timeline – Displays productive time (green), idle time (yellow), and private time (red); this shows how employees spent their work hours.
- Task Timeline – Real-time progress of assigned tasks.
- Work Graph – Pie chart showing the breakdown of worked, idle, and private time.
These insights help employees identify areas to optimize their work habits while keeping managers informed.
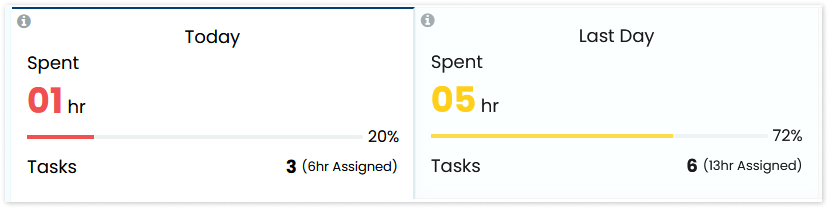
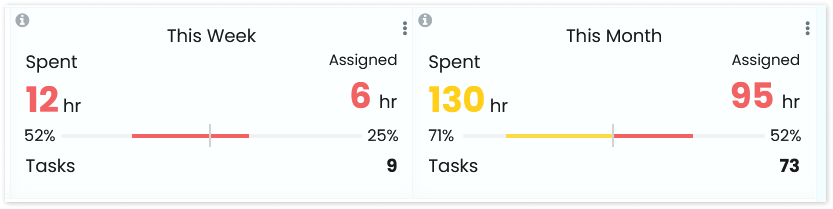
9. Task Management
Task Overview
Provides insights on time spent on tasks daily, weekly, and monthly, including:
- Total assigned task time
- Time spent on tasks
- Number of tasks completed
Reports for previous weeks and months
Task Timesheet
Displays:
- Completed & unfinished tasks
- Task names and associated projects
- Start dates, current status, assigned time, and time spent

Work/Time Graph
Bar graphs visualize work time versus task time, with flexible views:
- Last 7 days
- Current week
- Previous week
- Custom date range
These tools help employees and managers track progress, identify delays, and optimize task allocation.
10. Productive Apps & URLs
Desklog provides a clear view of digital habits:
- Productive Apps/URLs – Identifies the apps or URLs used for focused work and records the time spent on each.
- Non-Productive Apps/URLs – Tracks apps or URLs that may distract from work, along with their usage time.
- Neutral Apps – Recognizes apps that neither boost nor hinder productivity, providing usage metrics.
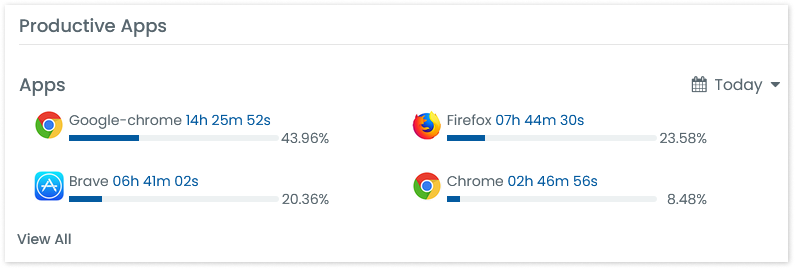
This data helps employees understand their digital behavior and create a healthier work routine.
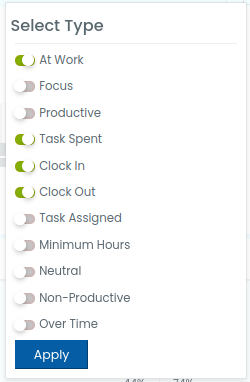
11. Navigation & Configuration
On the left side, multiple menus allow you to:
- Configure dashboards
- Generate reports
- Analyze team and individual performance
- Customize filters and settings for better insights
Desklog is designed to provide actionable insights while respecting privacy, allowing both employees and managers to work smarter and stay balanced.