
Understanding Key Performance Indicators (KPIs) and Their Role in Business Success

Goals only matter when progress can be clearly measured. By connecting project planning, task execution, productivity tracking, and profitability analysis, organizations can transform daily work into meaningful performance insights. A structured KPI approach ensures that every action contributes to measurable growth and smarter decision-making.
When KPIs connect directly to structured workflows, they become actionable insights instead of static reports. With real-time data from Desklog, businesses gain clarity, spot gaps early, and drive consistent growth.
What Are Key Performance Indicators?
Key Performance Indicators (KPIs) are measurable values that demonstrate how effectively an organization, team, or individual is achieving a specific objective. Unlike general metrics, KPIs are directly tied to outcomes that influence business success. They translate strategy into observable behavior converting ambitions like improved productivity or increased profitability into measurable signals.
KPIs as Measurable Signals of Business Health
A company aiming to improve operational efficiency cannot rely on subjective impressions like "teams seem busy." Instead, measurable indicators must be used, such as:
- Average productive hours per employee baseline of real work contribution
- Time spent on high-value tasks separates strategic effort from noise
- Project completion efficiency actual vs. estimated timelines
- Resource utilization rate how effectively capacity is being used
These indicators become meaningful only when supported by accurate performance data. With automated workforce analytics from Desklog, organizations can measure performance continuously without manual reporting. Desklog automatically captures:
| Tracking Feature | What It Captures |
|---|---|
| App & URL Tracking | Understand digital work patterns across the day |
| Activity Tracking | Identify productive and non-productive time blocks |
| Automatic Time Tracking | Eliminate manual timesheets entirely |
| Idle Time Tracking | Detect performance gaps before they compound |
| Automated Timesheets | Accurate reporting without admin overhead |
Because KPIs rely on objective behavioral data, automated measurement ensures that performance insights reflect reality rather than estimates.
Types of KPIs
Understanding KPI categories helps organizations evaluate performance from both a strategic and operational perspective. Grouping KPIs by organizational scope ensures leaders can track overall business health while managers monitor how daily work contributes to those outcomes.
Type 1: KPIs Based on Organizational Scope
High-Level KPIs
Evaluate overall organizational performance and long-term strategic progress. They focus on outcomes such as workforce productivity, project profitability, resource utilization, and revenue per employee.
Because these indicators reflect company-wide performance, they rely on consolidated data across departments. Centralized analytics from Desklog provide unified dashboards, utilization reports, and profitability insights to help leadership monitor strategic direction.
Low-Level KPIs
Measure operational performance at the team or individual level. They focus on execution metrics such as time spent per task, productive hours, attendance consistency, shift adherence, and task completion speed.
These indicators provide actionable insights that help managers optimize workflows, balance workloads, and address inefficiencies. Continuous tracking of time, attendance, and activity ensures decisions are based on real work patterns and operational behavior.
Type 2: KPIs Based on Contribution to Business Goals
This KPI classification explains how organizational effort converts into measurable business performance. It evaluates resources invested, execution efficiency, results produced, and long-term impact. Structuring KPIs this way helps organizations connect daily work with strategic outcomes using unified insights from Desklog.
Input KPIs
Measure the resources invested before results are generated. These indicators focus on workforce effort, time allocation, and operational capacity. Understanding input levels helps organizations manage costs, allocate resources effectively, and establish a baseline for productivity evaluation.
Measures total workforce time invested in operational activities. This indicator helps evaluate capacity utilization, workload distribution, and overall effort contribution across teams.
Measures how much time is allocated to individual initiatives. This indicator helps evaluate project effort requirements, planning accuracy, and resource allocation efficiency.
Continuously records work time without manual input. This ensures accurate measurement of workforce effort across tasks and operational activities.
Offline time tracking Captures work completed without internet connectivity. This ensures uninterrupted tracking of resource investment across all work environments.
Process KPIs
Measure how efficiently work is executed after resources are invested. These indicators evaluate workflow movement, execution speed, and operational consistency. Understanding process performance helps organizations identify inefficiencies and improve coordination across teams.
Measures the duration required to complete assigned work. This indicator helps evaluate execution efficiency, operational speed, and workflow effectiveness.
Measures how tasks move through operational stages. This indicator helps evaluate process continuity, coordination quality, and workflow stability.
Provides visual tracking of task stages and workflow movement. This supports continuous monitoring of execution flow and workload distribution.
Records time spent across different phases of execution. This supports evaluation of process efficiency and operational time distribution.
Monitors work behavior during task execution. This supports analysis of productivity patterns and operational efficiency trends.
Output KPIs
Measure the direct results generated from operational effort. These indicators focus on productivity levels and tangible deliverables. Evaluating outputs helps organizations determine whether operational execution produces measurable business value.
Measures the number of deliverables finished within a defined period. This indicator helps evaluate productivity levels and operational throughput capacity.
Measures financial value generated from completed work. This indicator helps evaluate output effectiveness and operational contribution to revenue.
Records financial transactions linked to completed work. This supports measurement of revenue generated from operational outputs.
Evaluates financial performance of completed initiatives. This supports analysis of value generated relative to resources invested.
Outcome KPIs
Measure the long-term impact of operational performance. These indicators evaluate sustained improvement, workforce stability, and strategic progress. Understanding outcomes helps organizations assess whether productivity gains are maintained over time.
Measures performance growth across defined time periods. This indicator helps evaluate effectiveness of operational improvement initiatives.
Measures long-term patterns in employee productivity. This indicator helps evaluate stability, consistency, and organizational performance development.
Provides aggregated analytics based on operational data trends. This supports evaluation of long-term performance progress and strategic outcomes.
Monitors workload balance and workforce sustainability indicators. This supports evaluation of stable productivity and long-term performance capacity.
Steps to Set Effective KPIs Through Real Project Execution
Effective KPIs are not created in isolation they emerge from structured work, measurable activity, and continuous performance evaluation. When projects are planned, executed, tracked, and evaluated systematically, KPIs become clear, meaningful, and actionable.
Below is how the standard KPI framework aligns naturally with project workflow.
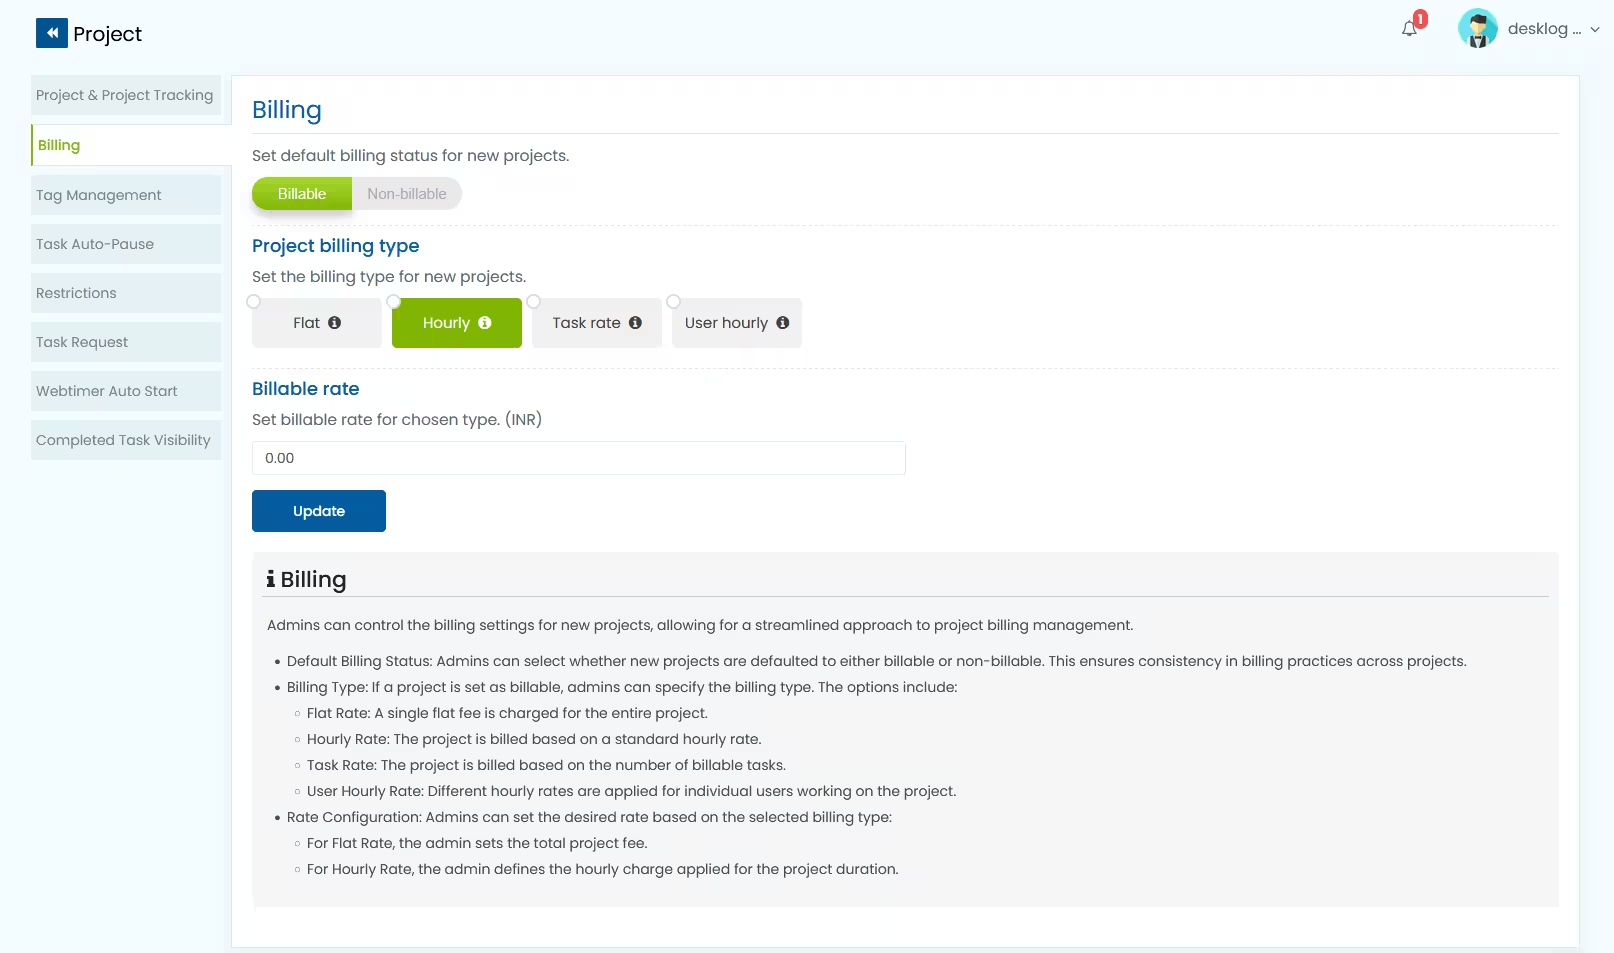
Define Your Goals → Project Creation & Financial Setup
Every KPI begins with a strategic objective. When a project is created, business intent is translated into measurable parameters that define what the organization aims to achieve.
At this stage, teams establish:
Why this step matters for KPIs
This stage provides the foundation for relevant and time-bound metrics. Without clearly defined project expectations, performance cannot be evaluated meaningfully.
KPI direction established here
- Delivery performance targets
- Cost and revenue expectations
- Resource utilization goals
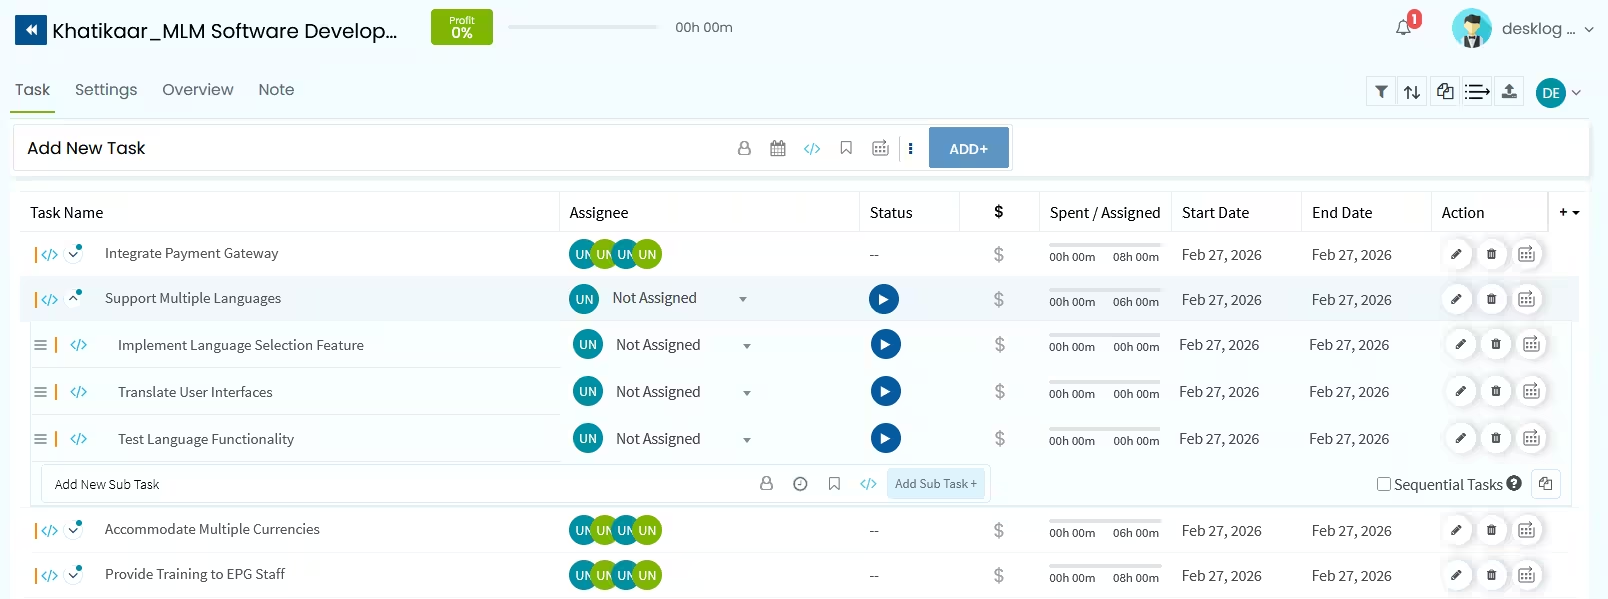
Define Success Using SMART Criteria → Task Structuring & Assignment
Once strategic intent is clear, success must be translated into measurable work. This happens when projects are broken into structured tasks that represent real execution.
Teams operationalize success by:
This structure ensures KPIs follow the SMART framework:
- Specific → Clearly defined work units
- Measurable → Estimated effort and deadlines
- Achievable → Based on capacity and resources
- Relevant → Directly tied to project outcomes
- Time-bound → Defined execution timeline
KPI clarity achieved here
Success is no longer abstract, it becomes measurable through planned effort, workload distribution, and expected completion time.
Identify Data Sources → Task Progress Tracking (Kanban Workflow)
KPIs require reliable data sources. These data points emerge when work progress is tracked consistently across defined workflow stages.
Desklog’s kanban view typically follows a structured flow:
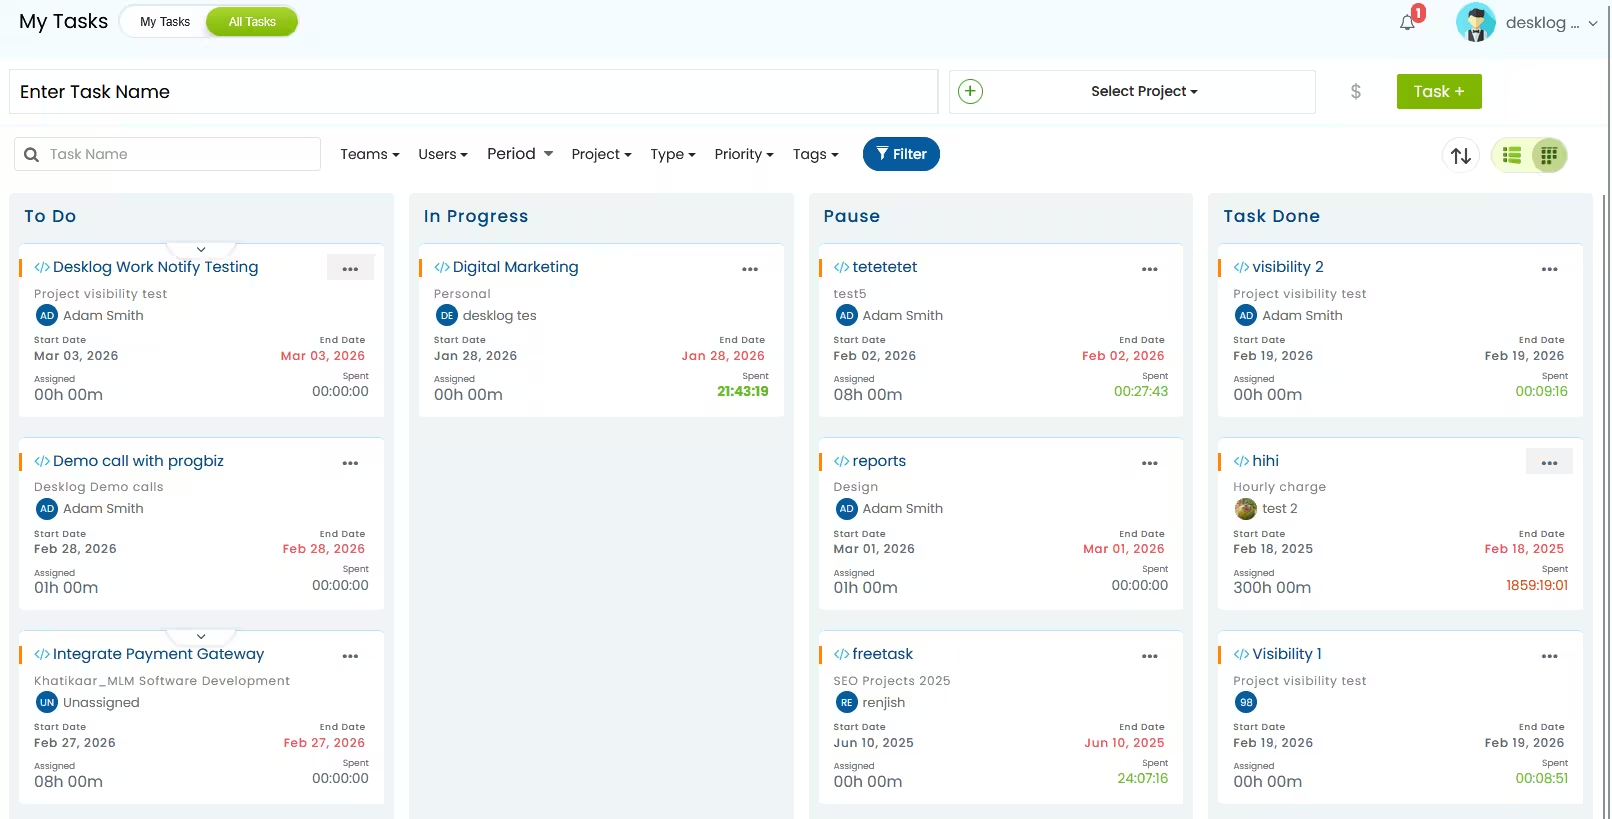
By monitoring how tasks move through these stages, organizations gain real-time operational data rather than relying on assumptions or manual reporting.
KPI data generated at this stage
- Task cycle time
- Completion velocity
- Work-in-progress volume
- On-time delivery rate
- Bottleneck patterns
These metrics act as leading indicators, helping teams predict performance outcomes before final results appear.
Assign Ownership & Keep KPIs Focused → Productivity Insights
Once execution data is captured, performance must be interpreted and owned. Productivity insights transform raw activity into meaningful performance evaluation across individuals, teams, and projects.
Desklog Insights typically reveal:
At this stage, organizations apply two critical KPI principles:
Accountability
Each KPI is assigned to a responsible role, ensuring performance monitoring leads to improvement actions.
Focus
Rather than tracking excessive metrics, teams concentrate on a few high-impact indicators such as:
- Average task completion time
- Productivity rate
- Resource utilization
- Efficiency trend
This keeps KPI systems practical and actionable.
Review and Adapt → Profit & Loss Evaluation
The final step evaluates whether execution actually delivered business value. Financial performance connects operational efficiency to strategic success
Desklog’s profit and loss analysis compares:
These are lagging indicators, they confirm the real outcome of all preceding activities.
KPI outcomes evaluated here
- Project profit margin
- Cost variance
- Budget adherence
- Financial performance per project
This stage completes the KPI lifecycle by turning performance measurement into strategic insight. The results inform future planning, resource allocation, and process improvements.
Working Of KPIs At A Glance
How the Full KPI Cycle Works in Practice
The workflow forms a continuous performance loop:
This ensures KPIs are:
- Aligned with business objectives
- Based on real execution data
- Actionable and accountable
- Continuously optimized
Key Principles for Effective KPI Design
Leading vs. Lagging Indicators
Both are necessary for a complete performance view.
Actionability
A KPI must inform decisions, not just report performance.
Context
Metrics gain meaning when compared to:
- Project estimates
- Historical performance
- Business targets
Example KPI Set Derived from Workflow
90% On-Time
90% of projects completed within estimated hours (Quarterly)
−15% Cycle Time
Reduce average task completion time by 15% (Monthly)
25% Margin
Maintain minimum 25% project profit margin (Per project)
75% Billable
Achieve 75% billable time ratio (Monthly)
Top KPI Examples by Business Function
Below are common KPI categories and how they relate to measurable execution data from structured project workflows.
Financial KPIs → Business Outcomes of Project Execution
Financial KPIs evaluate whether work produces sustainable business value.
- Net Profit Margin Revenue remaining after expenses
- Gross Profit Margin Revenue minus direct costs
- Burn Rate Speed of capital usage
- Revenue Growth Rate Increase in revenue over time
- Project profit margin
- Budget vs actual cost variance
- Revenue generated per project
- Cost efficiency per resource
These are lagging indicators, they measure final business impact.
Marketing & Sales KPIs → Revenue Generation Efficiency
These KPIs evaluate how effectively demand converts into revenue. They connect operational efficiency with revenue performance.
- Customer Acquisition Cost (CAC)
- Conversion Rate
- Marketing Qualified Leads (MQLs)
- Customer Lifetime Value (CLV)
- Average Sales Cycle
- Billable utilization rate
- Revenue generated per hour worked
- Project delivery speed
- Client billing accuracy
These metrics connect operational efficiency with revenue performance.
Customer Service KPIs → Delivery Quality & Reliability
Customer-related KPIs measure service effectiveness and experience quality.
- Net Promoter Score (NPS)
- Customer Churn Rate
- Average Resolution Time
- First Response Time
- On-time project completion rate
- Task turnaround time
- Delivery consistency
- Workload balance across teams
These are driven by how efficiently work progresses through execution stages.
Operational & HR KPIs → Productivity and Workforce Performance
Operational KPIs evaluate how effectively resources are used to produce results.
- Order Fulfillment Time
- Employee Turnover Rate
- Time to Hire
- Production Volume
- Average task completion time
- Productivity rate
- Resource utilization percentage
- Work-in-progress volume
These metrics act as leading indicators, predicting future performance outcomes.
How to Define a Good KPI in Practice
A KPI becomes meaningful only when it is tied to measurable execution data and a clear business objective. To define a strong KPI:
To define a strong KPI:
Start with a strategic objective
Example: Improve project profitability.
Identify measurable execution data
Example: Actual hours vs. estimated hours.
Set a clear target and timeframe
Example: Maintain at least 25% profit margin per project this quarter.
Assign responsibility
Example: Project manager owns delivery efficiency.
Review and refine regularly
Use performance insights to adjust targets and strategy.
Use performance insights to adjust targets and strategy.
How KPI Categories Align with the Execution Flow
If your page already explains the workflow, this is the logical mapping:
| Execution Stage | KPI Type Generated |
|---|---|
| Project setup & billing | Financial targets |
| Task structuring & assignment | Operational KPIs |
| Task progress tracking | Leading performance indicators |
| Productivity insights | Efficiency metrics |
| Profit & loss evaluation | Strategic outcome KPIs |
This ensures KPIs are not theoretical they are derived directly from how work is planned, executed, and evaluated.
Conclusion
KPIs deliver real value when they are tied directly to how work is planned, executed, and evaluated.
By connecting goals, task progress, productivity insights, and financial outcomes, organizations create a continuous performance loop that drives informed decisions and measurable improvement.
With workflow-driven tracking through Desklog, teams gain clarity, strengthen accountability, and consistently improve business performance.
KPIs are only as strong as the data behind them. When every metric is grounded in real execution data tracked automatically, reviewed consistently, and owned by the right people they stop being reports and start being the engine of continuous improvement.
Frequently Asked Questions
Clear answers on setting, using, and maintaining effective KPIs.
Meet The Author