


From Data to Dollars: Using P&L Calculators for Smarter Project Decisions
Updated on February 27th, 2026

Project managers in tech firms often face a familiar frustration: projects that appear profitable on paper
but
tell a different story once the invoices roll in. The culprit? Opaque profitability driven by inconsistent
time
tracking, manual data entry, and overlooked non-billable hours. In remote or hybrid teams, these small
inaccuracies can erode margins by up to 20%, distorting true project health.
But there’s a smarter, automated way to manage profitability. This guide will walk you through how to use a
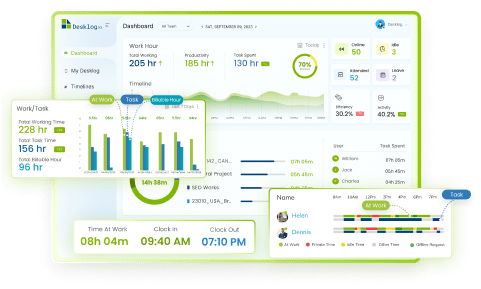
project profit and loss calculator effectively, showing you how tools like Desklog turn real-time time-tracking
data into actionable insights for precise, ethical, and confident decision-making.
By the end, you’ll know how to:
- Understand P&L fundamentals for project-based teams
- Choosing the Right P&L Calculator for Your Team
- Step-by-Step Guide to Implementing a P&L Calculator
- Advanced Tips for Maximizing P&L Efficiency
- Why Desklog.io Is Your Ideal P&L Partner
What is a project profit and loss (P&L) calculator, and how does it help improve project profitability?
A project profit and loss calculator is a tool that automatically computes the difference between project revenue and associated costs to reveal profitability. It factors in billable hours, resource expenses, and overhead costs. With Desklog, project managers can input tracked time and task data to instantly generate P&L reports, highlighting which projects, tasks, or resources are driving or draining profit. Using Desklog’s automation, can uncover 15–25% employee efficiency gains by identifying unproductive time and optimizing resource allocation, without relying on manual spreadsheets or error-prone calculations.Understanding the Basics of Project Profit & Loss
What Is a Project Profit and Loss Statement?
A Project Profit and Loss Statement is essentially a snapshot of a project’s financial health. It summarizes:- Revenues: Billable hours, task-based billings, client invoices
- Costs: Salaries, contractor fees, software subscriptions, operational overheads
- Net Profit: The difference between total revenue and total expenses
Profit = (Billable Revenue – Direct Costs) – Indirect Expenses
Desklog makes this process smooth. Its project time tracking automatically records hours spent, categorizes
billable vs. non-billable time, and integrates costs from multiple projects. This eliminates the manual
errors
that are common in tools like Clockify or Excel, ensuring accurate and timely P&L reports.
By using Desklog,
project managers no longer need to reconcile spreadsheets manually or risk overlooking hidden costs, such as
unlogged offline work or misassigned tasks. Instead, profitability becomes transparent, measurable,
and
actionable. Why P&L Calculators Are Essential for Tech Projects
In modern agile tech environments, projects are dynamic, deadlines shift, and teams are often distributed. Without proper visibility, costs escalate, and unproductive hours go unnoticed. Studies suggest that up to 30% of tech projects exceed budgets due to poor tracking and lack of timely insight. Desklog’s P&L calculator addresses these challenges by:- Tracking time across all tasks and apps: App and URL tracking reveal time sinks like unnecessary app usage or repetitive workflows.
- Integrating costs automatically: Salaries, resource allocation, and overheads feed directly into P&L calculations.
- Providing real-time insights: Project managers can identify underperforming tasks or teams immediately.
Common P&L Pitfalls in Project Management
Even seasoned project managers face recurring pitfalls in P&L calculations:- Underreported Offline Time: Work done offline, like research or coding without internet, often goes untracked, leading to inaccurate cost calculations. Desklog’s offline tracking captures every productive minute automatically.
- Hidden Non-Billable Hours: Tasks like team meetings or internal discussions can consume significant hours but are often omitted from P&L statements. Desklog allows categorization, helping managers separate billable vs. non-billable activities.
- Manual Reporting Errors: Relying on spreadsheets or manual time logs introduces mistakes that can skew profit analysis. Desklog’s automated calculations reduce this risk significantly.
Differentiating Gross vs. Net Project Margins
Understanding the distinction between gross and net margins is crucial for profitability analysis:- Gross Margin: Revenue minus direct costs (e.g., salaries for the developers working on the project). This shows how efficiently the team delivers billable work.
- Net Margin: Revenue minus all costs, including overheads such as software licenses, office rent, or utilities. This reflects the true profitability of the project.
- Direct costs: Tracked through task assignments and hours logged
- Indirect costs: Integrated from project budgets and organizational expenses
- Gross margins: Auto-calculated with app usage, URL tracking, and task completion rates, providing up to 40% more accurate results than manual methods
Choosing the Right P&L Calculator for Your Team
Selecting the right P&L tool is crucial for tech teams aiming to optimize project profitability. The ideal calculator not only automates calculations but also integrates smoothly with existing workflows while respecting team autonomy and privacy. Key Features to Look For in a P&L Tool
A modern P&L calculator should go beyond simple spreadsheets and manual calculations. Look for features like:- Automation: Automatic calculation of revenues, direct costs, and overheads reduces human error.
- Real-Time Reporting: Desklog’s P&L calculation syncs with task and project tracking to provide instant insights into profitability.
- Integration Capabilities: Easily connects with project management and time-tracking tools.
- User-Friendly Dashboards: Visualize margins, task performance, and resource allocation in one place.
- Well-Being Focus: Unlike competitors like Time Doctor, which rely on manual uploads and intrusive tracking, Desklog emphasizes ethical tracking with configurable screenshots and offline support.
Integrating Time Tracking with P&L Analysis
Time tracking is the backbone of accurate P&L calculations. Desklog ensures all work hours; online or offline are captured automatically, feeding directly into project profitability reports.- Billable vs. Non-Billable Hours: App and URL tracking categorize time spent on client-facing tasks versus internal work.
- Task-Level Analysis: Managers can see which tasks are profitable or consuming resources without generating extra admin work.
- Decision Empowerment: Real-time insights help teams optimize schedules, adjust resource allocation, and prevent hidden cost overruns, all without surveillance or intrusive tracking.
Privacy and Ethics in Profitability Tools
Financial insight should never come at the expense of employee trust. Desklog addresses privacy concerns through:- Configurable Screenshots: Through optional screenshots, teams can opt-in, ensuring visibility into work patterns without constant surveillance.
- Consent-Based Tracking: Managers get insights ethically, aligning with company policies and legal standards.
- Offline Support: Time spent offline is accurately captured, maintaining transparency without micromanagement.
Step-by-Step Guide to Implementing a P&L Calculator
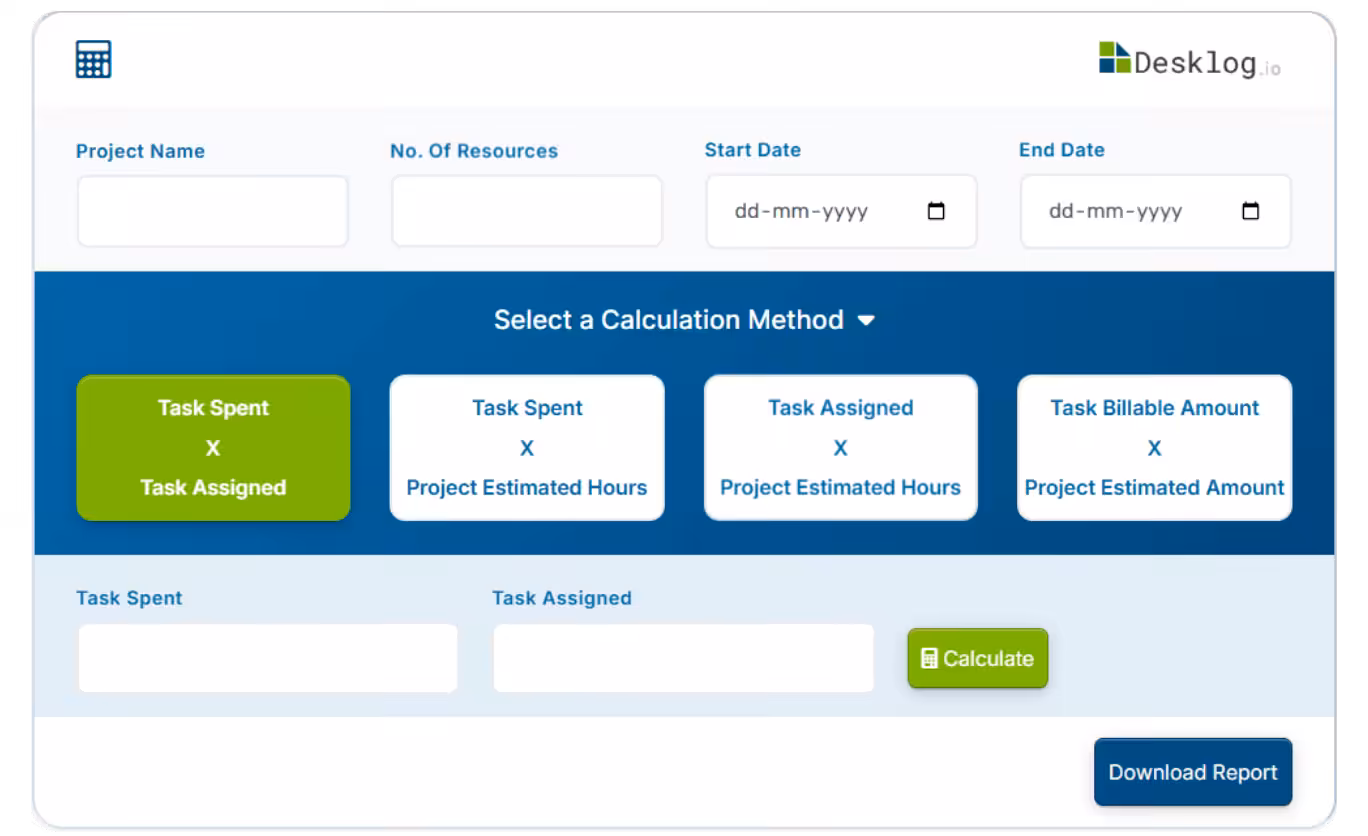
Implementing a P&L calculator doesn’t have to be complicated. By following a structured approach, project managers can quickly set up, run, and interpret reports to make data-driven decisions that boost profitability. Desklog’s P&L calculator allows project managers to evaluate project profitability quickly and accurately. Follow these steps to get started:Step 1: Fill in Project Details
At the top section of the calculator, input basic project information:- Project Name: Enter the name of the project you want to evaluate.
- No. of Resources: Specify how many team members are currently working on the project.
- Start Date: Set the date the project work began.
- End Date: Enter the expected or actual end date of the project.
Step 2: Choose a Calculation Method
Desklog offers four different ways to calculate project profit or loss. Select the configuration that best fits your analysis:Option 1: Task Spent vs Task Assigned
- Task Spent: Total hours spent on all project tasks.
- Task Assigned: Total hours allocated or planned for all tasks.
Profit % = 100 – (Task Spent ÷ Task Assigned × 100)
Example:
Task Spent = 90 hours
Task Assigned = 100 hours
Profit % = 100 – (90 ÷ 100 × 100) = 10%
Option 2: Task Spent vs Project Estimated Hours
- Task Spent: Total hours worked.
- Project Estimated Hours: Predicted total time required for the project.
Profit % = 100 – (Task Spent ÷ Project Estimated Hours × 100)
Example:
Task Spent = 90 hours
Project Estimated Hours = 100 hours
Profit % = 100 – (90 ÷ 100 × 100) = 10%
Option 3: Task Billable Amount vs Project Estimated Amount
- Task Billable Amount: Amount charged to the client for completed tasks.
- Project Estimated Amount: Total projected cost or revenue.
Profit % = 100 – (Task Billable Amount ÷ Project Estimated Amount × 100)
Example:
Task Billable Amount = $1000
Project Estimated Amount = $2000
Profit % = 100 – (1000 ÷ 2000 × 100) = 50%
Option 4: Task Assigned vs Project Estimated Hours
- Task Assigned: Total hours planned for all tasks.
- Project Estimated Hours: Predicted total time for the project.
Profit % = 100 – (Task Assigned ÷ Project Estimated Hours × 100)
Example:
Task Assigned = 90 hours
Project Estimated Hours = 100 hours
Profit % = 100 – (90 ÷ 100 × 100) = 10%
Step 3: Download Detailed Reports
After completing the calculation, you can download detailed reports on your project’s profit and loss analysis for sharing with stakeholders or integrating into project documentation.Advanced Tips for Maximizing P&L Efficiency
Optimizing project profitability goes beyond calculating basic profit and loss. By combining P&L analysis with productivity insights and industry benchmarks, project managers can drive smarter decisions and maximize margins.Combining P&L with Productivity Metrics
Desklog allows managers to integrate P&L calculations with productivity metrics for a complete view of project efficiency.- Non-Intrusive Screenshots: Desklog’s configurable screenshots capture workflow patterns ethically, helping identify bottlenecks without micromanaging the team.
- Resource Utilization Insights: Compare hours worked with actual task completion to detect underutilized resources or overallocated staff.
- Margin Improvement: By aligning productivity data with P&L reports, teams can optimize schedules and task assignments, often achieving up to 25% higher profit margins.
Handling Scope Creep in Calculations
Projects frequently face scope changes that can erode profits if left unchecked. Desklog helps monitor and adjust P&L in real time:- Task Tracking Alerts: Any unplanned additions to tasks or extended timelines trigger notifications for immediate review.
- Real-Time Impact Analysis: Managers can assess how scope changes affect overall project costs and margins instantly.
- Profit Preservation: By reacting promptly to scope creep, teams can prevent up to 15% profit erosion, keeping projects on track financially.
Benchmarking Against Industry Standards
Desklog enables teams to compare their project performance against industry benchmarks, helping set realistic expectations and optimize resource allocation:- Tech Sector Benchmarks: Use Desklog’s aggregated data to measure employee performance against typical productivity and cost metrics in your sector.
- Resource Utilization Reports: Identify areas where your team is over- or under-utilized relative to industry norms.
- Strategic Adjustments: Benchmarking allows project leads to make informed decisions about staffing, task allocation, and timeline planning to maximize profitability.
The End
Why Desklog Is Your Ideal P&L Partner?
Desklog stands out by combining automated time tracking with a built-in P&L calculator, delivering accurate, privacy-respecting insights that empower teams to boost margins. Unlike competitors’ invasive tools, Desklog focuses on employee well-being through configurable features, offline support, and non-intrusive productivity tracking. Project managers can track billable hours, task assignments, and resource utilization in real time while generating complete P&L reports effortlessly. Teams gain actionable insights to identify inefficiencies, optimize resource allocation, and improve project profits by 20–30%. With Desklog, organizations achieve financial transparency, ethical tracking, and smarter project decision-making; all from a single platform.FAQs
1What is a project profit and loss calculator?
A project profit and loss (P&L) calculator automatically compares project revenue
and
expenses to reveal true profitability. Desklog’s version uses live data from
automated time tracking and cost inputs, giving instant and accurate insights
instead of manual calculations.
2How does Desklog calculate project P&L?
Desklog combines billable hours from time tracking with recorded expenses like
labor
and overhead. It then generates detailed reports showing real-time margins,
helping
teams track project profitability without spreadsheets or manual effort.
3Can P&L tools improve remote team profitability?
Yes. Desklog’s offline and app tracking ensure every hour worked is captured,
even
without internet access. Managers gain clear visibility into workload and
efficiency, allowing them to reduce wastage and improve margins ethically.
4Is Desklog’s P&L feature privacy-compliant?
Absolutely. Desklog uses configurable screenshots and transparent activity
tracking
to ensure productivity monitoring never invades employee privacy. It aligns with
workplace ethics and modern data protection standards.
5How accurate are P&L forecasts with Desklog?
Desklog achieves up to 95% accuracy by combining real-time data with historical
reports. This helps businesses predict outcomes, plan resources better, and make
confident financial decisions.
6Does Desklog’s P&L calculator integrate with billing and invoicing?
Yes. Desklog links billable hours directly to project billing, turning tracked
time
into precise invoices. It eliminates disputes, ensures transparency, and builds
client trust through accurate reporting.
7Can Desklog forecast future project costs?
Definitely. Desklog analyzes previous project data to estimate upcoming costs and
expected margins. This helps managers plan budgets proactively and set
realistic,
profitable project rates.
Meet The Author

Sreejitha Ashok 
Product Specialist & Research Head