


Introducing Desklog Insights– A Complete View of Employee Details in One Place

Why Insights Matter in Desklog
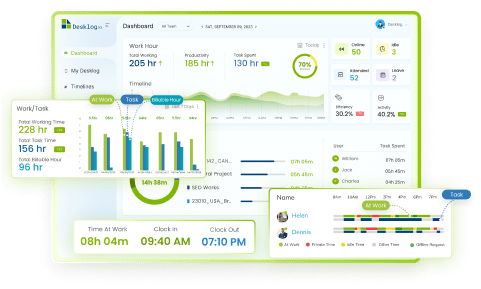
Desklog is a complete time tracking software designed to improve employee productivity and focus. As an all-in-one solution, Desklog integrates time tracking, project tracking, attendance tracking, billing and invoicing as well as shift scheduling.
With Desklog’s brand new insights session, you can now have full access to precise data in one single view.

What is Desklog Insights?
“All Your Reports. One Smart Dashboard.”
It consolidates all tracked data into a clean, easy-to-navigate dashboard, eliminating the need to switch between multiple reports or spreadsheets.
With real-time visibility, it enables you to quickly access the information you need to make smarter, faster choices.
Searching for the best overtime tracker for your team? Check out our blog for the perfect guide to the top five tools for tracking employee overtime.
Read More: Top 5 Tools to Track Employee Overtime Hours
.
Why We Introduced the Desklog Insight Session
Managing a team, especially in a growing company, comes with its own set of daily challenges. One of the most frustrating ones? Wasting time piecing together scattered information.
For many team leads, managers and startup founders, a typical workday means toggling endlessly between:
- Attendance logs in one system
- Productivity reports in another
- Project updates from spreadsheets or chat threads
- Timesheets from yet another tool
That’s why we created the Desklog Insights.
It’s a single, unified dashboard that pulls in all your key operational data such as productivity, attendance, task progress and project metrics so you can see everything that matters in one glance.
With Insights, you can:
- Make decisions faster with real-time, organized data
- Stop switching tabs or tracking down reports
- Identify trends early, like consistent late starts or slipping deadlines
- Spot top performers and those who need support
- Balance workloads and keep an eye on team well-being
Key Benefits of the Desklog Insight Session

All Key Metrics in One Place
Access everything from productivity stats to project performance in one unified, easy-to-navigate dashboard.

Real-Time Insight into Productivity and Attendance
Track when your team clocks in, what they’re working on, how their time is allocated, and where productivity might be falling behind instantly and accurately.

Smarter Management Through Simplified Data
Gain actionable insights without needing deep analytics expertise. The dashboard interprets the data for you, making it easier to focus on strategic decisions.

Accelerated Decision-Making with Visual Insights
Clear charts and intuitive visuals make it easy to evaluate employee efficiency rates, project timelines, and resource use so you can respond faster and more effectively.
Wondering how remote work can benefit start-ups? In this guide, we’ll break down the why and how of building a successful remote-first startup.
Read More: How Remote Work Can Benefit Startups – A Complete Guide for 2025
.
How to Access and Use the Desklog Insight Session
You can access Desklog Insights simply by logging into your Desklog account and navigating to the section titled Insights in the admin dashboard. It allows you to view both monthly and yearly data, organized by team for easier analysis.
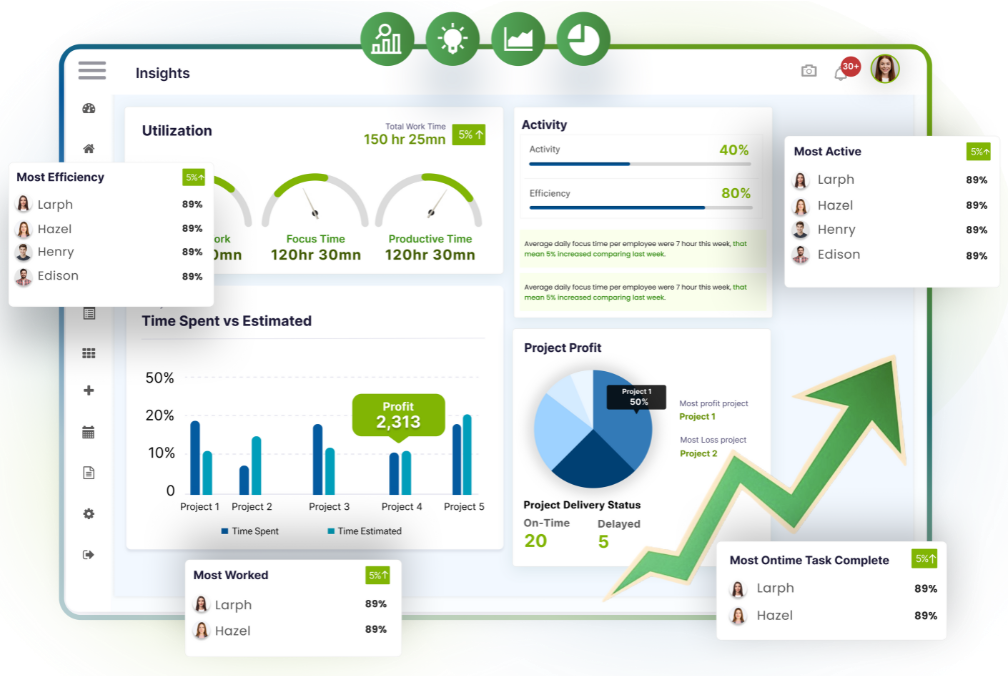
With Desklog Insights, you get a full overview of the following key metrics:
Time Utilization Trends
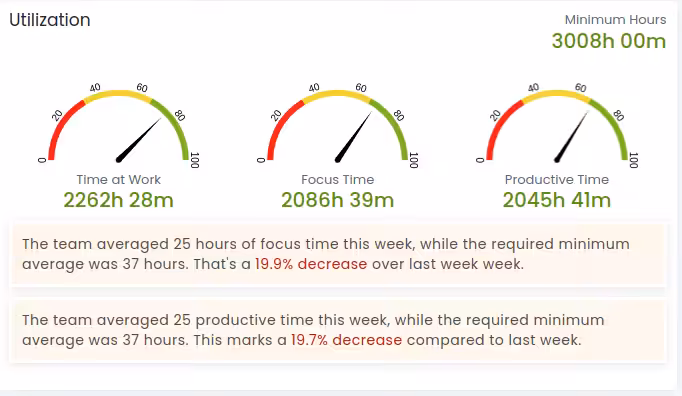
This section provides a breakdown of how employees are utilizing their work hours by comparing Time at Work, Focus Time, and Productive Time against the minimum required hours.
Performance Trends
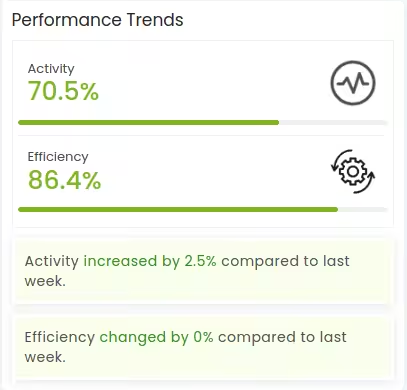
Offers a complete view of performance trends by displaying total activity levels and efficiency percentages for all users over a selected period.
Project Status
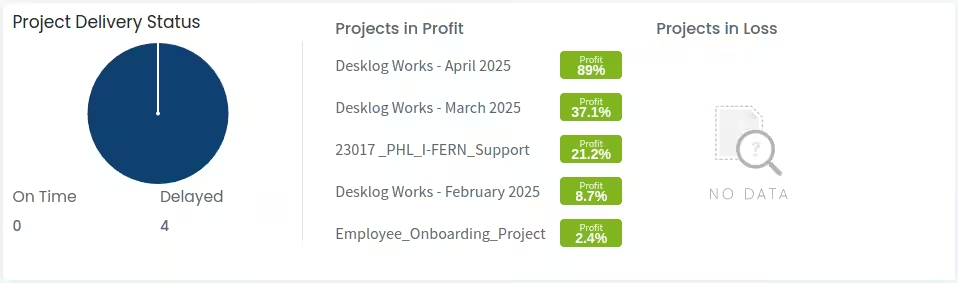
This section provides a clear snapshot of how projects are progressing in relation to planned timelines and budgets. It includes:
Time Spent vs. Estimated
Compares the actual time spent on each project against the initially estimated hours.
On Time or Delayed
Tracks whether projects are being completed within their scheduled timelines or facing delays.
In Profit or In Loss
Evaluates the financial health of each project by comparing earned revenue (based on billable hours or rates) against the cost of time spent.
App Usage Trends
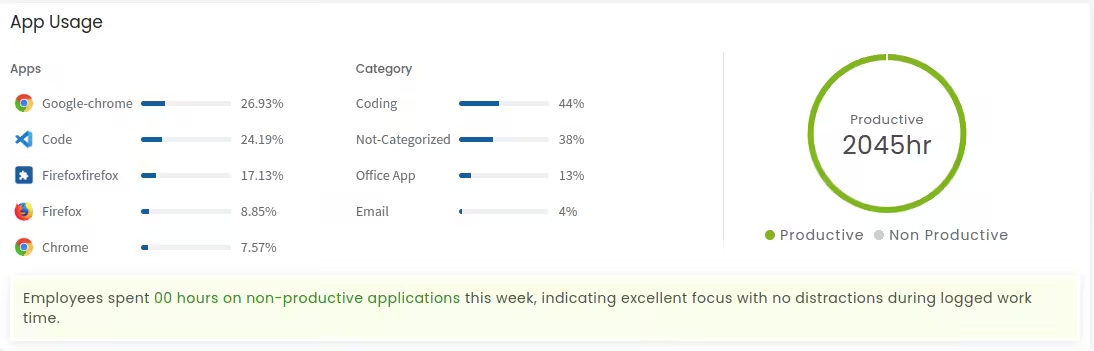
Tracks the time employees spend on different software and applications, classifying each as either productive or non-productive. It also provides a percentage breakdown by application and category for clearer insights into software usage patterns.
Work & Timing Trends
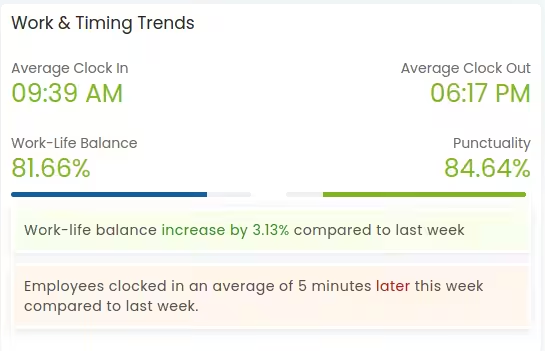
This section offers a comprehensive view of employee time management by analyzing key aspects of their daily routines. Collectively, they help evaluate workplace efficiency, discipline, and overall employee well-being.
Average Clock-In and Clock-Out
Shows the typical check-in and check-out times.
Work-Life Balance
Highlights the ratio of active work hours to break or personal time.
Punctuality
Measures how regularly employees begin work on time according to their scheduled start times.
Task Overview
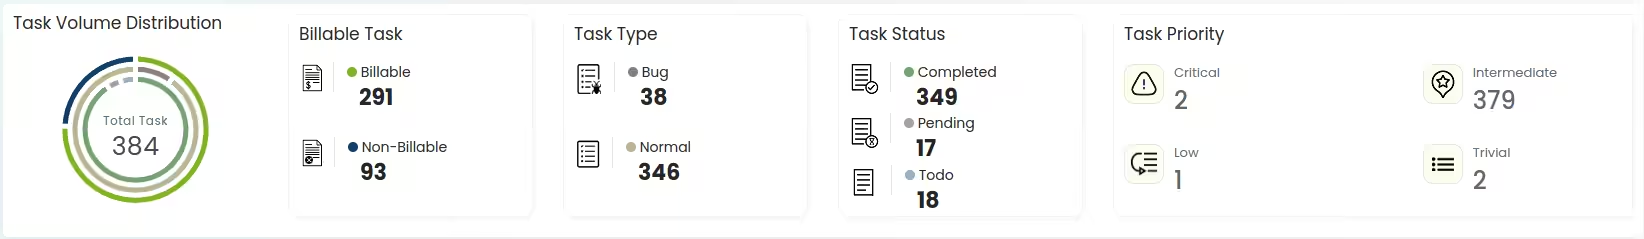
This section offers an overview of task and project workflows within the team, supporting the tracking of project timelines, revenue generation and effective resource allocation.
Total Tasks
Shows the overall number of tasks assigned to users across the team.
Billable Tasks
Displays a comparison between billable and non-billable tasks to help track revenue-generating work.
Task Types
Categorizes tasks by type, indicating how many are classified as Bug vs. Normal.
Task Statuses
Breaks down tasks by their current status, including Completed, Pending, and To-Do.
Task Priorities
Shows the distribution of tasks based on priority level: Critical, Intermediate, Low, and Trivial.
Delayed Projects
Lists all projects that have surpassed their deadlines or are currently falling behind schedule.
Leave Trends
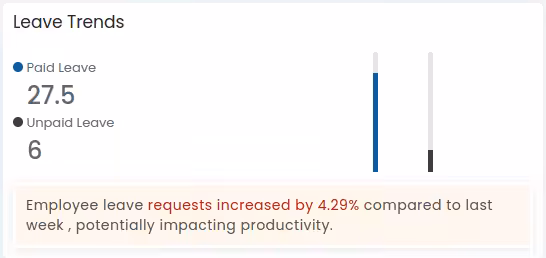
Tracks the number of Paid and Unpaid leaves taken by employees over a selected time period, supporting attendance and workforce planning.
Employee Performance Highlights
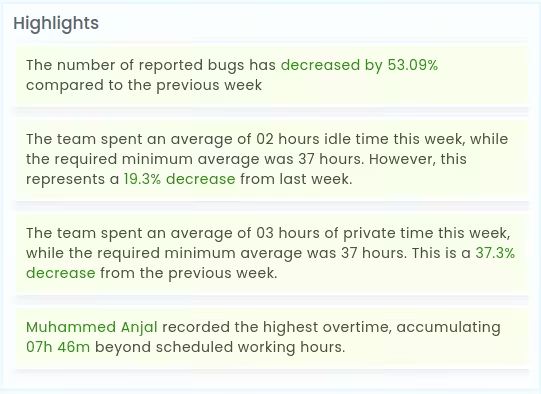
This section highlights employee performance and productivity by identifying key contributors and potential challenges. Together, these metrics provide valuable insights into individual work habits and team efficiency.
Quick Resolver
Identifies employees who regularly complete their tasks in less time than allocated, demonstrating speed and efficiency.
Slow Responder
Flags team members who frequently exceed the expected time to complete tasks, helping managers address potential bottlenecks.
Most Efficient
Ranks employees based on their overall efficiency, highlighting top performers and setting a benchmark for team productivity.
Most Worked
Displays individuals who have logged the highest number of working hours during a given period, helpful for tracking overtime and acknowledging extra contributions.
Most Active
Highlights employees with the greatest levels of system activity during work hours, reflecting high engagement.
Most On-Time Task Completions
Recognizes team members who consistently deliver tasks on or before the assigned deadlines.
Is project deadlines stressing you out? In this blog, we’ll explore expert techniques, practical tools and proven best practices to help you estimate project timelines accurately.
Read More: Project Time Estimation: Expert Tips and Methodologies
.
Who Will Benefit the Most from Desklog Insights?
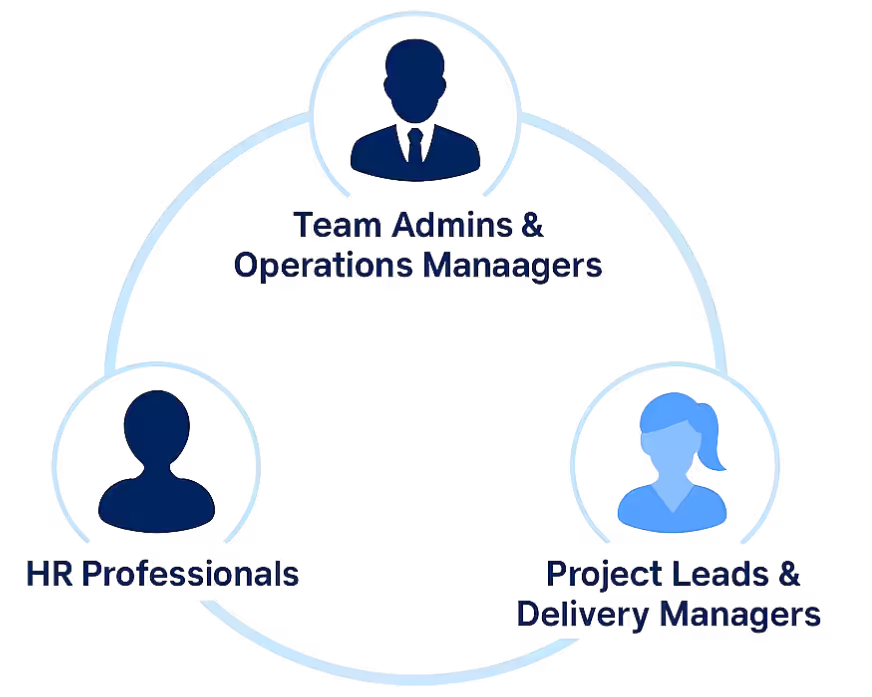
Team Admins & Operations Managers
If you’re managing remote teams, staying aligned across time zones and work environments can be challenging. Desklog Insights gives you a centralized, real-time view of productivity, attendance, and active work hours so you can ensure accountability without micromanagement.
HR Professionals
For HR teams, tracking attendance, breaks, and work patterns is essential for managing payroll, compliance, and employee wellbeing. Desklog Insights simplifies this by automatically capturing login/logout times, break durations, and overall working hours, all in one place.
Project Leads & Delivery Managers
Need to stay on top of multiple projects and tasks? Project leads can track task progress, time spent per project, and compare actual work against estimates. This helps ensure timely delivery, optimal resource allocation, and early detection of bottlenecks.
Conclusion
Desklog Insights is more than just a reporting tool. It’s a strategic asset for team leaders and decision-makers. By bringing together real-time data on productivity, attendance, project progress and employee performance into one centralized dashboard, it eliminates guesswork and simplifies daily management tasks.
For anyone leading teams, especially in remote or hybrid environments, this feature offers unmatched visibility and clarity. It’s a step toward smarter, more data-based leadership, helping you make quicker decisions, identify trends early, and ensure your team stays aligned and productive.
FAQ
1 What is Desklog Insights?
Desklog Insights is a centralized reporting feature that provides a real-time, visual dashboard of key metrics like productivity, attendance, task status, and project performance.
2 How is Desklog Insights different from regular reporting tools?
Unlike traditional reporting systems that require pulling data from multiple sources, Desklog Insights consolidates all critical metrics into one intuitive dashboard for instant visibility and smarter decision-making.
3 What kind of data does Desklog Insights track?
Desklog Insights tracks:
- Time utilization (Time at Work, Focus Time, Productive Time)
- Performance and efficiency trends
- Project timelines and profitability
- Software and app usage
- Attendance, breaks, and punctuality
- Task progress and billability
- Leave summaries
- Individual employee performance indicators
4 Who should use Desklog Insights?
It’s ideal for:
- Team Admins & Operations Managers managing hybrid or remote teams
- HR Professionals overseeing attendance, breaks, and compliance
- Project Leads tracking task delivery, budget vs. actuals, and team efficiency
5 Can I view data for specific time periods or teams?
Yes. Desklog Insights allows users to filter data by monthly or yearly views and team-based segments, making it easy to analyze trends over time or by specific departments or groups.
6 Is any technical expertise needed to use Desklog Insights?
Not at all. Desklog Insights is designed with a user-friendly interface featuring visual charts, graphs, and summaries that anyone can understand—no advanced analytics skills required.
Meet The Author

Product Specialist & Research Head
