


Productivity vs Efficiency: A Step-by-Step Workplace Guide

Most teams talk about productivity and efficiency as if they were the same thing. They’re not. One team celebrates higher output, but quality drops. Another team cuts costs and time, but misses strategic goals. Both are optimizing the wrong metric at the wrong moment.
This guide shows you how to clearly separate productivity from efficiency, how to calculate both with simple formulas, and how to choose the right focus for your business stage without burning out your team.
You’ll also learn how productivity tools like time tracking software can help you turn productivity and efficiency metrics into actionable decisions for managers and teams.
We’ll look at:
- What Is Productivity in the Workplace?
- What Is Efficiency in the Workplace?
- Key Differences: Productivity vs Efficiency
- Which Matters More? A Leader’s Decision Framework
- Step-by-Step Framework to Improve Both (Action Plan)
- Exact KPIs & How to Measure Them
- Tools, Templates & Quick Integrations
- Balancing Both Without Causing Burnout (People-First Rules)
- Productivity vs Efficiency in Remote & Hybrid Teams
- Common Mistakes and How to Avoid Them
Productivity
The amount of output produced per unit of time.
Efficiency
The amount of useful output produced per unit of input (time, cost, or resources). High-performing teams track and balance both, not one in isolation.
What Is Productivity in the Workplace?
Productivity measures how much work gets done in a given period of time. It focuses on the speed and volume of output produced by individuals, teams, or an entire organization.
Definition
In practical workplace terms, productivity at work shows the relationship between output and time.
It helps managers understand whether work is being delivered fast enough to meet business goals, customer demand, and internal capacity needs.
In other words, productivity is not about how hard people work; it is about how much meaningful work is completed within a fixed timeframe.
Productivity Formula
Productivity = Total completed output ÷ Total time spent
What Is Efficiency in the Workplace?
Efficiency measures how well resources are used to produce useful results. It focuses on how effectively time, money, people, and materials are converted into outcomes that actually create value.
Definition
In workplace terms, efficiency shows how much valuable or usable output you get for every unit of input such as:
Inputs Measured
- Employee time
- Operational cost
- Tools and technology
- Materials or infrastructure
Efficient teams deliver results with minimal waste, rework, and unnecessary effort, without sacrificing quality.
Efficiency Formula
Efficiency = Useful output ÷ Total input
Key Differences: Productivity vs Efficiency
The difference between productivity and efficiency is that productivity focuses on speed and volume while efficiency focuses on resource usage and waste.
| Area | Productivity | Efficiency |
|---|---|---|
| Core focus | Output over time | Useful output per input |
| Main metric | Output / hour, day, sprint | Cost per unit, time per task, waste |
| Main risk | Rushing and quality loss | Over-optimization and slow delivery |
| Typical goal | Do more, faster | Do the same with less |
| When to prioritize | Capacity growth, new initiatives | Margin pressure, cost control |
Which Matters More? A Leader’s Decision Framework
The right metric depends on your business stage, operational constraints and quality expectations.
There is no universal rule for choosing between productivity and efficiency. High-performing leaders decide deliberately based on what is limiting results right now.
To make the right call, evaluate your organization using the four drivers below.
-
1.Business Stage
Your growth phase strongly influences whether you should prioritize productivity or efficiency.
Early-stage and fast-growing teams usually struggle with:
- limited delivery capacity,
- long backlogs,
- delayed launches
- and overloaded employees.
In these situations, the biggest risk is not producing enough output fast enough. This means productivity is typically the first priority.
Mature or scaled organizations, on the other hand, often struggle with:
- complex processes,
- duplicated roles and approvals,
- bloated workflows,
- and rising operational costs.
Here, output volume may already be stable, but the organization is paying too much to produce it. In this stage, efficiency usually becomes the dominant focus.
Rule of thumb
-> Growth phase → productivity first
-> Scale and maturity phase → efficiency first -
4.Margin pressure
Margin pressure is one of the clearest indicators of what to prioritize.
If your revenue is growing but:
- profit margins are shrinking, or
- operating costs are rising faster than revenue,
Then even small efficiency improvements can create significant financial impact.
Examples of margin-driven efficiency priorities:
- reducing rework and error rates,
- shortening delivery cycles,
- lowering cost per project,
- reducing excessive overtime or contractor usage.
When margins are healthy, leaders often have more freedom to invest in productivity initiatives such as new productivity tools, training, or additional headcount.
-
3.Capacity constraints
Capacity constraints signal a productivity problem.
If your teams consistently experience:
- overloaded sprint backlogs,
- missed deadlines,
- constant reprioritization,
- or delayed customer commitments,
the organization does not have enough delivery speed or throughput.
In this case, improving efficiency alone will not solve the problem.
You must first increase productivity by:
- removing blockers,
- improving task prioritization,
- reducing context switching,
- and protecting focused work time.
This allows teams to produce more outcomes in the same amount of time.
-
4. Quality and compliance needs
Not all environments can safely optimize for speed or cost.
In regulated, safety-critical, or customer-impact-heavy contexts such as healthcare, finance, enterprise SaaS, or infrastructure quality failures are far more expensive than slow delivery.In these environments:
- pushing productivity too aggressively can increase error rates,
- efficiency improvements that remove control steps can introduce compliance risks.
If your organization operates under strict quality, audit, or regulatory requirements, you should:
- stabilize efficiency first,
- protect quality gates,
- reducing context switching,
- and only then optimize productivity within safe limits.
Step-by-Step Framework to Improve Both
Improving productivity and efficiency together requires clarity, measurement and continuous review.
Step 1 – Define desired outputs and success criteria
Clarify what counts as real work.
Examples:
- Completed client deliverables
- Released product features
- Closed revenue
Step 2 – Capture baseline metrics
Create a simple CSV with:
- Task name
- Time spent
- Output delivered
- Cost estimate
Step 3 – Reduce waste and remove blockers (efficiency tactics)
Examples:
- Eliminate duplicated approvals
- Reduce handoffs between teams
- Standardize recurring workflows
Step 4 – Remove friction and speed high-impact work (productivity tactics)
- Clear prioritization rules
- Fewer context switches
- Dedicated focus time blocks
Step 5 – Automate and standardize where possible
Examples:
- Automated status reporting
- Pre-built templates
- Workflow triggers
Step 6 – Review, iterate, and embed into cadence
- Monthly KPI review
- Retrospectives
- Quarterly metric reset
Exact KPIs & How to Measure Them
Track a small, balanced set of productivity and efficiency KPIs.
| Productivity | Efficiency |
|---|---|
| Output per hour | Cost per unit |
| Tasks completed per day | Time per task |
| Revenue per employee | Rework or defect rate |
| Projects delivered per sprint | Utilization percentage |
Tools, Templates & Quick Integrations
Simple tool stacks are enough to operationalize productivity vs efficiency tracking.
-
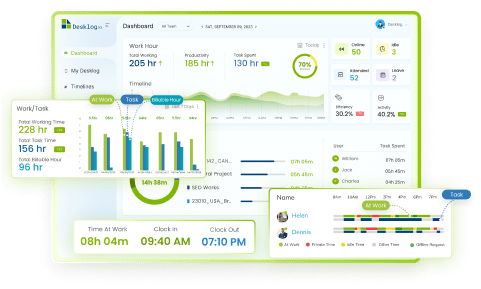
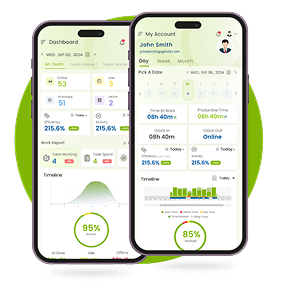
Time Tracking & Productivity Analytics — Desklog
Desklog is a workforce intelligent time tracker that offers various productivity dashboards for actionable insights into working time, project effort, and productivity trends.
Quick setup tip:
- Track time by task and project.
- Export weekly productivity reports.
-
Task and work management
ClickUp allows teams to link tasks, goals, and delivery metrics in one workspace.
Quick setup tip:
- Connect tasks to measurable deliverables.
- Use simple status rules (not complex workflows).
-
Automation and data connections
Zapier connects time tracking, task tools, and reporting systems without custom development.
Quick setup tip:
- Automatically push completed tasks into KPI sheets or BI tools.
Balancing Both Without Causing Burnout (People-First Rules)
Pushing productivity and efficiency too aggressively can damage performance instead of improving it.
Early Warning Signals
- Quality complaints rising
- Error or rework rate increasing
- Overtime becoming normal
- Declining engagement scores
Practical Protection Policies
- Cap weekly overtime
- Enforce recovery time after peak periods
- Shift from activity targets to outcome targets
- Run short retrospectives after major delivery cycles
Wellbeing Metrics to Add to Dashboards
- Average weekly hours
- Overtime trend
- Workload distribution across team members
Productivity vs Efficiency in Remote & Hybrid Teams
Remote work amplifies hidden inefficiencies and false productivity signals.
Unique Challenges
- Async delays
- Context switching across tools
- Unclear ownership
- Distributed handoffs
Practical Adjustments
- Measure outcomes, not online presence
- Use async checklists for handoffs
- Time-box collaboration sessions
- Track focus time vs meeting time
Outcome-based KPIs are far more reliable than screen-time metrics in remote environments.
Common Mistakes and How to Avoid Them
Most teams fail because they optimize a single metric in isolation. Recognizing these patterns early protects both performance and morale.
Common mistakes
- Obsessing over one KPI
- Poor data quality
- Ignoring employee feedback
- Over-automating broken processes
Quick remedies
- Always pair one productivity metric with one efficiency metric
- Validate data monthly
- Include teams in workflow redesign
- Fix processes before automation
Conclusion
Productivity vs efficiency is not a choice between speed and cost; it is a leadership discipline.
Productivity tells you how fast your organization delivers results.
Efficiency tells you how well your organization uses its time, money, and resources to produce those results.
The most successful teams do not chase one metric in isolation. They:
- clearly define what “real output” looks like,
- measure both delivery speed and resource usage,
- apply the right focus based on business stage, margin pressure, capacity limits, and quality risk, and
- continuously rebalance before burnout, rework, or waste appear.
By using a structured decision framework, a small and practical KPI set, and a repeatable improvement cycle, leaders can improve performance without pushing teams into unsustainable workloads.
See real results from productivity and efficiency with real-time performance insights!
Try Desklog for Free Now!FAQ
Efficiency measures how well time, cost, and resources are converted into usable output.
In short: productivity focuses on speed, efficiency focuses on resource use.
Optimizing only one often creates hidden costs, delays, or burnout.
Productivity = Output ÷ Time
For example: 40 resolved tickets in 8 hours equals 5 tickets per hour.
Efficiency = Useful output ÷ Total input
For example: 90 usable units from 100 total units equals 90% efficiency.
Productivity asks: How much work did we finish in a given time?
Efficiency asks: How many resources did it take to finish that work?
Both describe performance, but from different angles.
Efficiency = how well inputs (time, money, resources) are converted into usable output.
Utilization = how much of available capacity is being used.
High utilization does not guarantee high productivity or high efficiency.
Meet The Author

Product Specialist & Research Head
