Average Salary In India 2025
The Indian economy is developing as each day passes by and has both challenges and opportunities. With its large population and growing middle class, it has a lot of potential for growth.
According to a report by Salary Explorer, in 2026 the average salary in India is 32,000 INR per month, offering an annual income of 384,000 INR. This reflects a steady and reliable earning potential, providing a solid foundation for personal growth and financial stability. With opportunities for career advancement, this figure highlights India’s growing economy and its ability to offer competitive salaries in various sectors.
In the professional world, especially within service-based industries, understanding the distinction between billable and non-billable hours is essential for accurate median salary calculations. employe monitoring software can help make this easier by accurately tracking both billable and non-billable hours.
The average salary in India per month depends on several factors such as factors like industry, location, experience, and education. Since India is a developing country, the average salary in India is much lesser compared to developed countries like the USA, UK, and Russia.
In this blog, we’ll explore the average Indian salary, compare it with other countries, and examine the minimum wage. We’ll also dive into the top three industries frequently outsourced to India, revealing why the country remains a global outsourcing hub.
What Is Average Salary?
The typical income earned by workers in a specific industry, economy, or region over a given time period is referred to as the average salary. It gives us an idea of how much people generally earn in that specific group.
Let’s Understand with an Example:

To find the average salary, we follow these steps:
1) Add Up All the Salaries:
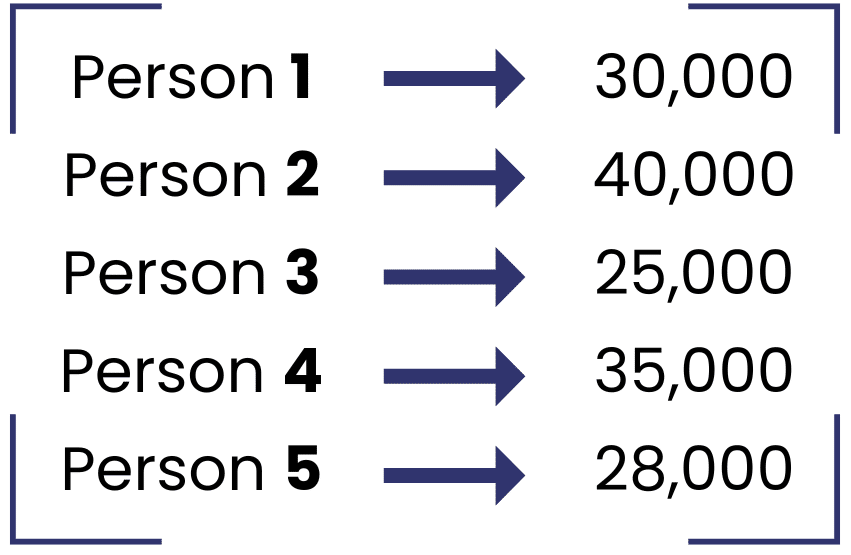
30, 000+40, 000+25, 000+35, 000+28, 000=158, 000
2) Divide by the Number of People:
158, 000/ 5=31, 600
So, in this example, the average salary for the group is INR 31, 600. This number gives a general sense of how much each person typically earns in this group.
Several factors can influence a person’s monthly income, such as different project billing types. For instance, if the billing type is set to hourly, employees will be paid according to the hours they work on a specific project, which may fluctuate from month to month. However, this will not impact their average salary.
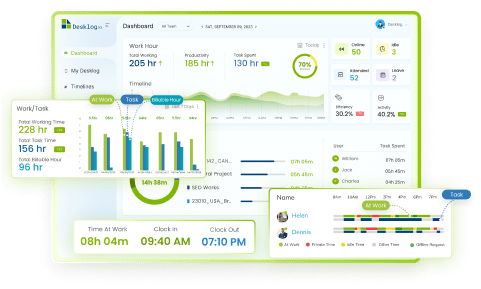
Considering all these small fluctuations, manually calculating billable hours each month can become a daunting task, but automated project time tracking tools like Desklog with project billing features simplify this process, providing an accurate distinction between total billable and non-billable hours.
Salary Ranges In India
The average salary in India per month can vary a lot depending on the job and industry. Some workers might earn as little as 8, 080 INR per month, especially in entry-level jobs or lower-paying sectors. On the other hand, experienced professionals or those in specialized roles can make up to 143, 000 INR per month. This wide range shows how different jobs and industries can have very different pay levels in India.
What is the Indian Median Salary?
India’s median salary is 27,300 INR per month, but what exactly does “median salary” mean? The median salary is the middle point in a list of salaries. If you were to line up everyone’s salary from lowest to highest, the median salary is the one right in the middle. This means that half of the people earn less than 27, 300 INR per month, and the other half earn more. The median gives a clearer picture of what most people actually earn because it isn’t affected by extremely high or low salaries.
What is the Annual salary Increment in India?
Compared to the other countries India has the highest salary increase. In 2023, the salary hike trends in India have shown significant variation across different sectors, positions, and company policies. According to reports, the average salary increment for Indian employees is between 8.5% and 9.2%, reflecting a steady growth trajectory compared to the previous two years. In 2021, the average salary increase stood at 8.8%, which then saw a rise to 9.7% in 2022. These figures indicate a consistent upward trend in salary hikes across various industries, despite fluctuations in the economic environment. And the expected Salary hike for 2026 is 9% which is comparatively good. When we take out the reports from 2020 to 2026, the average salary increment aligns in the promising range of 8.5 – 10 %. While the private sector shows robust increments, particularly in manufacturing, professional services, and financial services, the public sector remains more conservative but stable with DA adjustments. The variation across junior, mid, and senior roles also emphasizes how companies are strategically allocating salary increases to align with talent retention, employee development, and business needs.
Employee productivity and employee efficiency rates play an important role in influencing salary increments. Companies often base salary hikes on the value employees bring to the organization, such as achieving performance targets or contributing to overall business growth. Higher productivity and consistently meeting or exceeding expectations can result in larger salary increments, as businesses reward employees who demonstrate significant impact on the company’s success.
Salary Comparison In India
While it’s simple to find the average salary in a country, what you actually pay an employee can vary widely based on several key factors. These include their profession, industry, level of education, work experience, and where they’re located.
Further in this article, we’ll take a closer look at how these factors shape salaries in India, breaking down the average pay across different categories to give you a clearer picture.
1. By Profession
| Profession | Average Salary in India (per year) |
|---|---|
| Medical Professionals | INR 10 lakh |
| Data Scientist | INR 9.5 lakh |
| Machine Learning Experts | INR 6.9 lakh |
| Blockchain Developer | INR 8 lakh |
| Full Stack Developer | INR 6.7 lakh |
| Product Management | INR 14 lakh |
| Management Consultant | INR 11 lakh |
| Investment Banker | INR 9.6 lakh |
| Chartered Accountant | INR 9 lakh |
| Marketing Manager | INR 7 lakh |
Source: Forbes
2. By Age
| Age Range | 10% | 75% | 90% | Average Salary |
|---|---|---|---|---|
| Below 24 years | Rs. 3,900 | – | Rs. 11,937 | Rs. 5,905 |
| Between 25 to 34 years | Rs. 3,900 | Rs. 14,400 | Rs. 25,181 | Rs. 10,780 |
| Between 35 to 44 years | Rs. 3,900 | Rs. 18,444 | Rs. 33,639 | Rs. 13,777 |
| Between 45 to 54 years | Rs. 3,900 | Rs. 15,97 | Rs. 30,678 | Rs. 11,932 |
| Above 55 years | Rs. 3,900 | Rs. 13,871 | Rs. 25,002 | Rs. 10,365 |
3. By Gender
| Gender | Average Salary Per Year |
|---|---|
| Male | Rs. 1,953,055 |
| Female | Rs. 1,516,296 |
4. By Education
| Educational Level | Average Salary In India (Per Year) |
|---|---|
| Doctorate Degree | INR 2, 752, 407 |
| Masters Degree | INR 2, 126, 111 |
| Bachelor’s Degree | INR 1, 697, 592 |
| High School | INR 1, 153, 703 |
| Below High School | INR 1, 112, 499 |
Source: Forbes
5. By Location
| States | Average Monthly Salary |
|---|---|
| Uttar Pradesh | INR 20, 730 |
| West Bengal | INR 20, 210 |
| Maharashtra | INR 20, 110 |
| Bihar | INR 19, 960 |
| Rajasthan | INR 19, 740 |
| Madhya Pradesh | INR 19, 740 |
| Tamil Nadu | INR 19, 600 |
| Karnataka | INR 19, 150 |
| Gujarat | INR 18, 880 |
| Orissa | INR 18, 790 |
| Andhra Pradesh | INR 18, 520 |
| Jharkhand | INR 18, 430 |
| Kerala | INR 18, 290 |
| Punjab | INR 18, 120 |
| Assam | INR 17, 860 |
| Chattisgarh | INR 17, 570 |
| Haryana | INR 17, 330 |
| Uttranchal | INR 17, 140 |
| Delhi | INR 17, 100 |
| Jammu and Kashmir | INR 17, 010 |
| Tripura | INR 16, 760 |
| Himachal Pradesh | INR 16, 640 |
| Manipur | INR 16, 420 |
| Meghalaya | INR 16, 260 |
| Nagaland | INR 16, 120 |
| Pondicherry | INR 15, 620 |
| Arunachal Pradesh | INR 15, 590 |
| Goa | INR 15, 540 |
| Mizoram | INR 15, 390 |
| Sikkim | INR 15, 130 |
| Chandigarh | INR 14, 940 |
| Dadra and Nagar Haveli | INR 14, 630 |
| Andaman and Nicobar Islands | INR 14, 350 |
| Daman and Diu | INR 14, 290 |
| Lakshadweep | INR 14, 260 |
Source: Forbes
6. By Experience
| Experience | Average Progress |
|---|---|
| 2 to 5 years | +32% |
| 5 to 10 years | +36% |
| 10 to 15 years | +21% |
| 15 to 20 years | +14% |
| 20+years | +9% |
Source: Forbes
Get started with a free trial and see Desklog’s features in action.

What Is The Minimum Wage In India ?
The minimum wage represents the lowest base salary that must be paid to an employee per day.
In India, unlike many other countries, there isn’t a uniform national minimum wage. Instead, it is determined by both the Central and State governments under the Minimum Wages Act of 1948. As a result, the minimum wage varies significantly across different Indian states.
For example, in New Delhi, the minimum wage for an unskilled worker is set at 673 INR (approximately 7.31 USD) per day. In contrast, the minimum wage in Bihar is much lower, at 304 INR (around 3.63 USD) per day.
Consequently, the average hourly or daily wage you pay your employees will vary depending on the state in which you operate.
Average Salary in India vs World
Based on factors such as unemployment rates, standards of living, and overall economic development, the United Nations categorizes countries into the following groups:
-
Developed Economies
-
Developing Economies

Transition Economies
1. Average Salary in Developed Countries
| Country | Average Salary Per Month |
Comparison to Average Salary in India (in %) |
|---|---|---|
| United Kingdom | 8, 092 USD | 180% |
| United States | 7, 900 USD | 179% |
| Norway | 5, 696 USD | 172% |
| Germany | 4, 493 USD | 165% |
| Austria | 4, 470 USD | 165% |
Source : salaryexplorer.com
2. Average Salary in
Transition Economies
| Country | Average Salary Per Month |
Comparison to Average Salary in India (in %) |
|---|---|---|
| Georgia | 2, 191 USD | 134% |
| Russia | 1, 392 USD | 106% |
| Albania | 923 USD | 73% |
| Kazakhstan | 903 USD | 71% |
Source : salaryexplorer.com
3. Average Salary in Developing Countries
| Country | Average Salary Per Month |
Comparison to Average Salary in India (in %) |
|---|---|---|
| Thailand | 2, 949 USD | 149% |
| Philippines | 875 USD | 69% |
| Vietnam | 748 USD | 54% |
| Egypt | 587 USD | 31% |
| Pakistan | 508 USD | 17% |
Source: salaryexplorer.com
The lower salary trends and cost of living in India can be attributed to several factors. As a developing economy with a lower GDP per capita, India naturally has lower average wages compared to developed countries. The cost of living is also considerably lower, including expenses for housing, food, and healthcare.
Additionally, the large labor force and varying levels of education contribute to lower average salaries. Economic policies and market competition further influence wage levels, often keeping them lower. Currency exchange rates also play a role, as the Indian Rupee’s value compared to major currencies affects salary comparisons, though local purchasing power remains relatively higher.
Get a personalized demo and discover Desklog’s Time Tracking features.

Industry Outsourcing in India
Estimates suggest that India holds a 44% share of the global market for outsourcing software and back-office services. Cost savings are the primary driver behind outsourcing, and India has consistently proven to be the most cost-effective option. Labor costs in countries like the US, UK, Australia and Canada are significantly higher compared to those in India.
While you can outsource nearly any task to India, here are some of the most commonly outsourced ones:
1. Information and technology (IT) services:
According to certain statistics, revenue in the IT outsourcing sector is projected to grow at an annual rate (CAGR 2026-2029) of 13.52%, reaching a market volume of USD 20.81 billion by 2029.
For example, the average salary in India for an IT services manager is around 1, 365 USD. In comparison, hiring the same role would cost approximately 5811 USD or more per month in the United Kingdom and about 6, 500 USD per month in the United States.This illustrates the significant cost differences across countries, making India an attractive option for outsourcing.
You can outsource IT services like technical support, software development, and website and mobile app development to India.
2. Business Process Outsourcing
According to a report, the business process outsourcing (BPO) market, valued at USD 6, 077.36 million in 2022, will reach USD 12, 378.73 million by 2030, growing at a CAGR of 9.3% during the forecast period of 2023 to 2030.
India is a leading outsourcing destination for customer care services, largely due to its low average salary for BPO workers.
For instance, the average Indian salary for a call center agent is around 201 USD. In contrast, hiring the same role would cost approximately 350 USD per month in South Africa and 420 USD per month in Brazil.
3. Knowledge process outsourcing (KPO)
KPO (Knowledge Process Outsourcing) centers on delivering knowledge-driven services, like data analytics and information technology, to assist in core business operations.
Managing large volumes of data demands extensive resources and a skilled workforce. Due to low average salary in India, outsourcing KPO services to the country allows you to access these services at a much lower cost.
The average Indian salary for a data analyst is around 666 USD. In comparison, hiring a data analyst would cost significantly more in other popular outsourcing destinations, such as Malaysia (800 USD per month) and the Czech Republic (1, 200 USD per month).
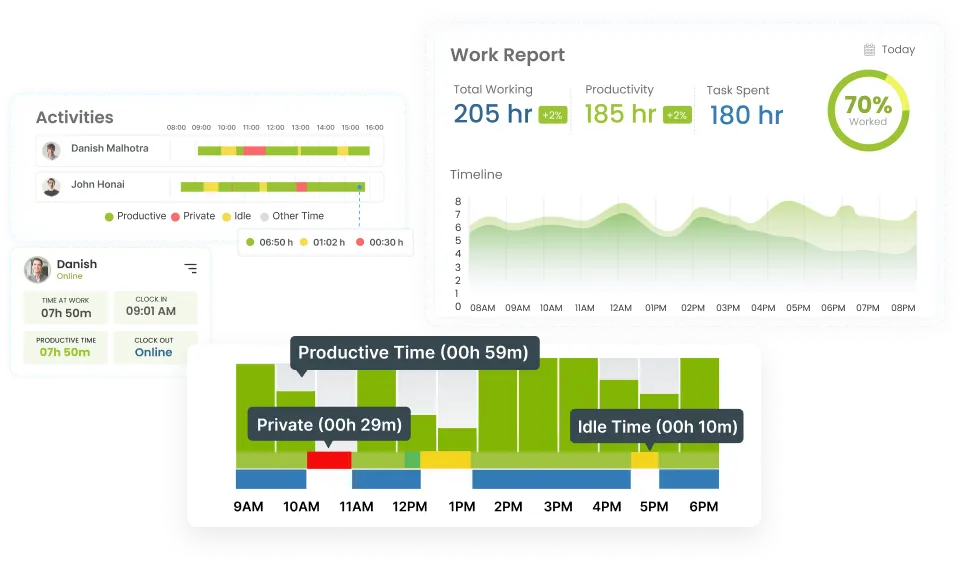
You can monitor the productivity and performance of your outsourced employees by using time tracking software.
Moreover, with Desklog’s automated timesheetyou can simplify payroll management and can effortlessly handle salary payments in various currencies.
Conclusion
While the average salary in India per month is gradually rising, it remains lower than in many other countries. This makes it possible to access a skilled workforce at cost-effective rates, which is why India continues to be a favored destination for outsourcing.
Additionally, the country’s growing economy, expanding middle class, and emphasis on education and technology continue to attract global companies. As these trends persist, India’s role in the global marketplace is likely to strengthen, offering even more opportunities for both local professionals and international businesses.
Enhance your time tracking with Desklog—just one click away.

FAQ
1What is the average salary in India for software engineers?
The average Indian salary for a Software Engineer is INR 8, 90, 000 per year.
2What is the average Indian Salary in USD?
Average monthly salary is INR 32, 840, which equates to approximately $422 USD with the current exchange rate.
3What is the average doctor salary in india?
The average annual salary for doctors is around INR 9.6 lakhs.
4What is the average salary in India for data scientists?
The average salary for a Data Scientist is INR 14.2 lakhs per year in India.
5What is the average salary in the india?
In 2026, the average salary in India is 32, 000 INR per month or 3, 84, 000 INR per annum. That is 382 USD per month.
6Average salary in india vs usa
The average salary in India in 2026 is 382 USD as per the recent exchange rates. With this, we know that the average salary in India is lower than the average salary in the USA which is about USD 7, 900.
7Average salary in india for freshers
Fresher salary in India with less than 1 year of experience to 3 years ranges from INR 0.4 Lakhs to INR 5.5 Lakhs with an average annual salary of INR 2.8 Lakhs


