Desklog Insights
Desklog Insights offers a centralized dashboard that gives a complete overview of employee productivity, project performance, and work patterns. From time utilization and task trends to profitability and punctuality, it helps managers track key metrics at a glance.
Utilization
The first section will be ‘Utilization’. This section shows how employees are spending their working hours by comparing Time at Work, Focus Time, and Productive Time with the minimum required hours. It helps managers see how time is used and find ways to improve focus and productivity.
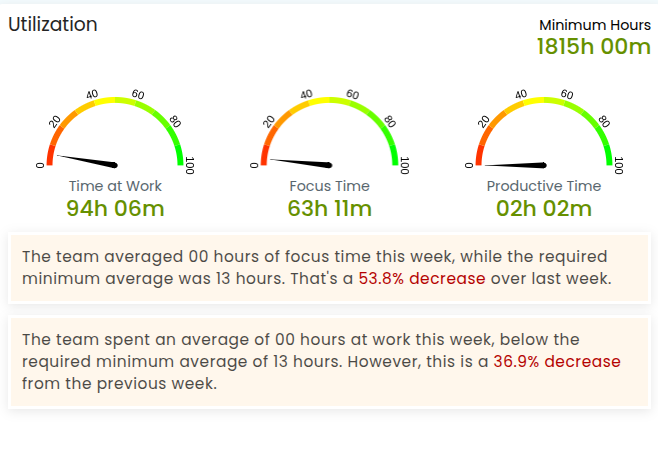
In the top right corner, you’ll find the minimum hours worked by users. Just below that, you can view detailed breakdowns of Time at Work, Focus Time, and Productive Time; each displayed separately. You’ll also see insights comparing these metrics to the previous week, offering a clear view of trends and changes in work patterns.
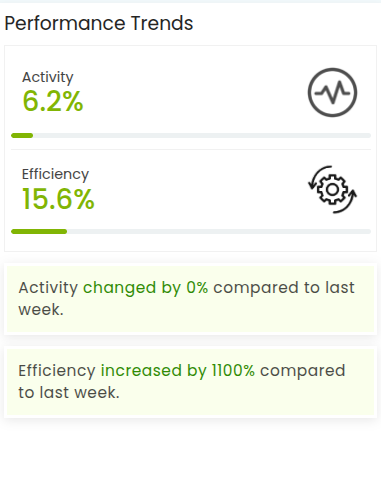
Performance Trends
Right next to it, you’ll find a section called ‘Performance Trends’, which offers a complete overview of overall performance. It displays total activity levels and efficiency percentages for all users over time, helping you track performance patterns and identify shifts in team productivity.
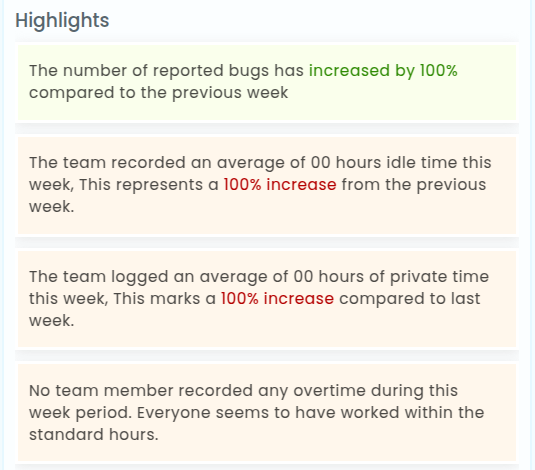
Highlights
The ‘Highlights’ session provides a clear overview of all key highlights at a glance, along with a comparison to the previous week.
Project Spent Time vs Assigned Time
The Project Spent Time vs Assigned Time highlights data for the top 5 projects based on the most time spent and compares it with the assigned estimated time.

Project Status
Displays the current stage of all ongoing projects, indicating whether they are On Time or Delayed. Helps track progress at a glance.
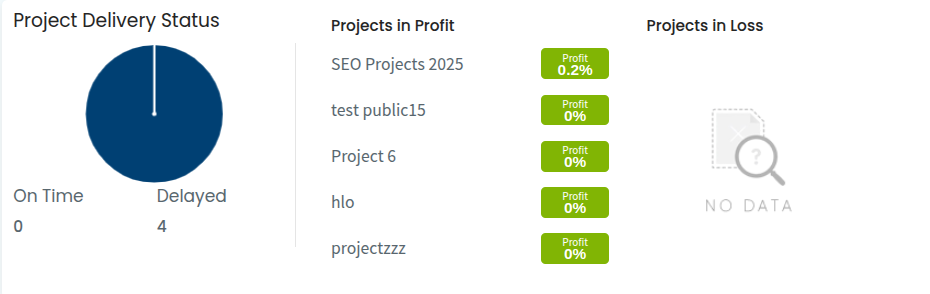
Projects in Profit
Highlights the top 5 projects that generated the highest profits. Useful for understanding which types of work deliver the most value to the business.
Projects in Loss
Shows the top 5 projects with the highest financial losses. Helps identify areas where improvements are needed to avoid future risks.
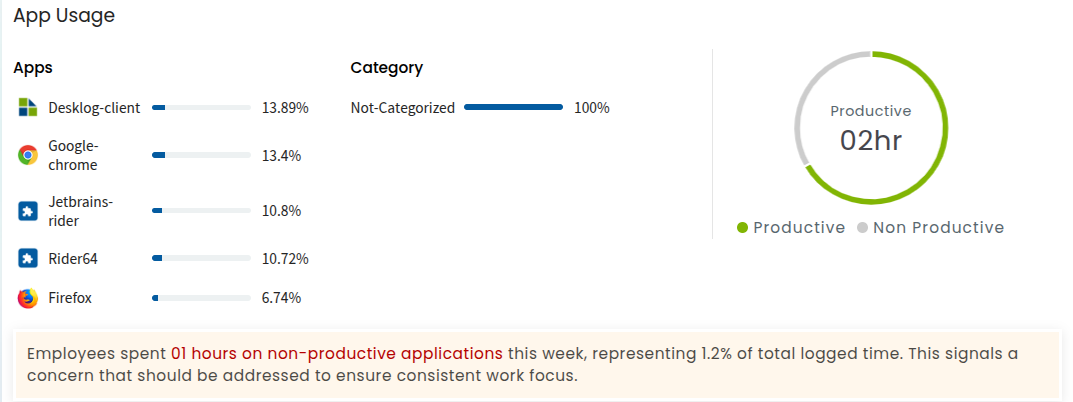
App Usage
Tracks time spent across various software and applications, categorizing usage as productive or non-productive, and provides percentage breakdowns by app and category.
Work & Timing Trends
Shows the average time employees start and end their workday.
It helps track team-wide punctuality trends, overtime patterns, and workday consistency across departments.
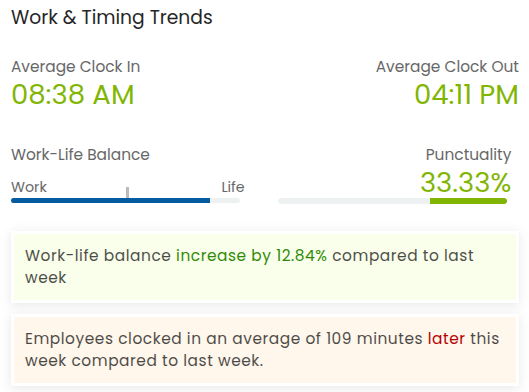
Work-Life Balance shows how much time is spent on work compared to breaks or personal time.
A good balance helps maintain steady productivity and well-being. Less balance may mean higher focus, but should be managed carefully.
Punctuality assesses how consistently employees start their work on time based on scheduled clock-in hours.
Useful for maintaining discipline, improving time management, and enforcing workplace policies.
Task Volume Distribution
Task Volume Distribution provides a structured overview of task allocation across key parameters such as type, status, priority, and billing. It enables efficient workload management and supports data-driven decision-making.

Total Tasks
Displays the total number of tasks assigned across users. Offers a quick snapshot of overall task volume.
Billable Tasks
Shows the count of Billable vs. Non-Billable tasks, helping track which tasks contribute to revenue and which are internal.
Task Types
Breaks down tasks by type, showing how many are Bug tasks and how many are Normal tasks. Useful for understanding workload distribution.
Task Statuses
Highlights the number of tasks in each status: Completed, Pending, and To-Do. Helps monitor workflow progress and detect delays.
Task Priorities
Displays task counts across priority levels: Critical, Intermediate, Low, and Trivial. Helps focus attention where it’s needed most.
Leave Trends
The Leave Trends shows the number of Paid and Unpaid leaves taken by employees. Useful for spotting trends that may affect team capacity and productivity.

Quick Resolver
The ‘Quick Resolver’ highlights employees who consistently complete their tasks faster than the assigned time.
These individuals can be recognized as efficient performers or even potential mentors for others.
Slow Responder
The ‘Slow Responder’ flags individuals who often take longer than the assigned time to complete their tasks.
This insight helps managers identify coaching needs or investigate causes like unclear task requirements or workload overload.
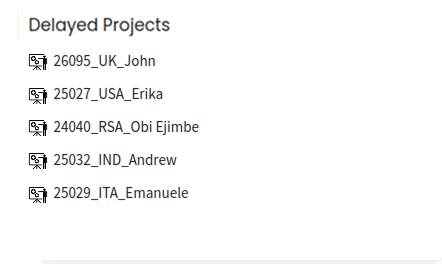
Delayed Project
This section lists all projects that have missed their deadlines or are behind schedule.
Helps managers reassign resources, communicate with stakeholders, and take corrective actions to get things back on track.
Most Efficient
‘Most Efficient’ section ranks employees by their efficiency rate to spotlight top performers and establish performance benchmarks for the team.

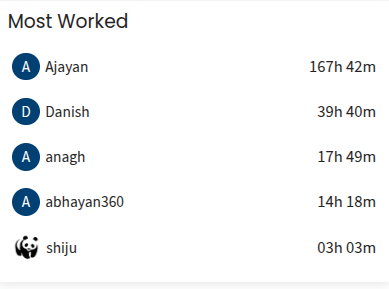
Most Worked
The ‘Most Worked’ section displays employees who have logged the most hours during the period. Useful for tracking overtime and recognizing extra effort.
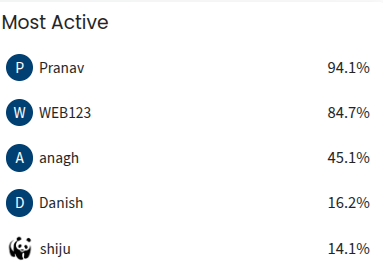
Most Active
The ‘Most Active’ section shows employees with the highest activity levels during work hours. It highlights who stays most engaged and available throughout.
On-Time Performer
As the name suggests the ‘On-Time Performer’ highlights employees who complete the highest number of tasks on time, promoting accountability and timely delivery.