The Utilization Page in Desklog helps you understand how effectively employees are using their work hours by comparing planned time with actual time spent on tasks.
Accessing the Utilization Page
- Go to the left panel and click on Analytics.
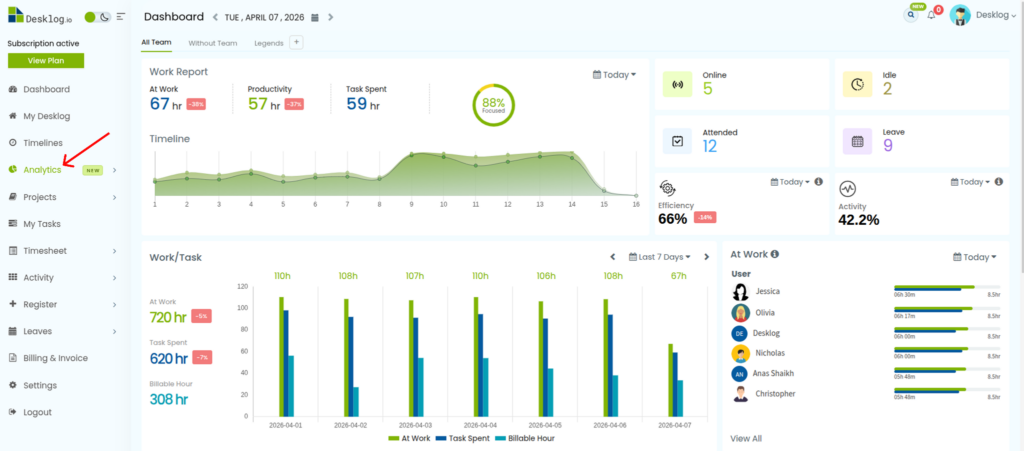
- From the dropdown, select Utilization.
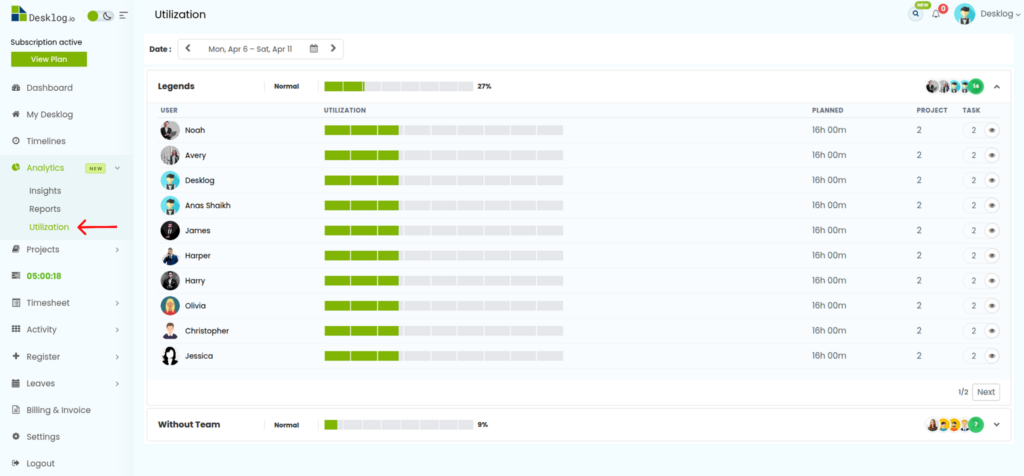
This will open the Utilization dashboard.
Understanding the Utilization Dashboard
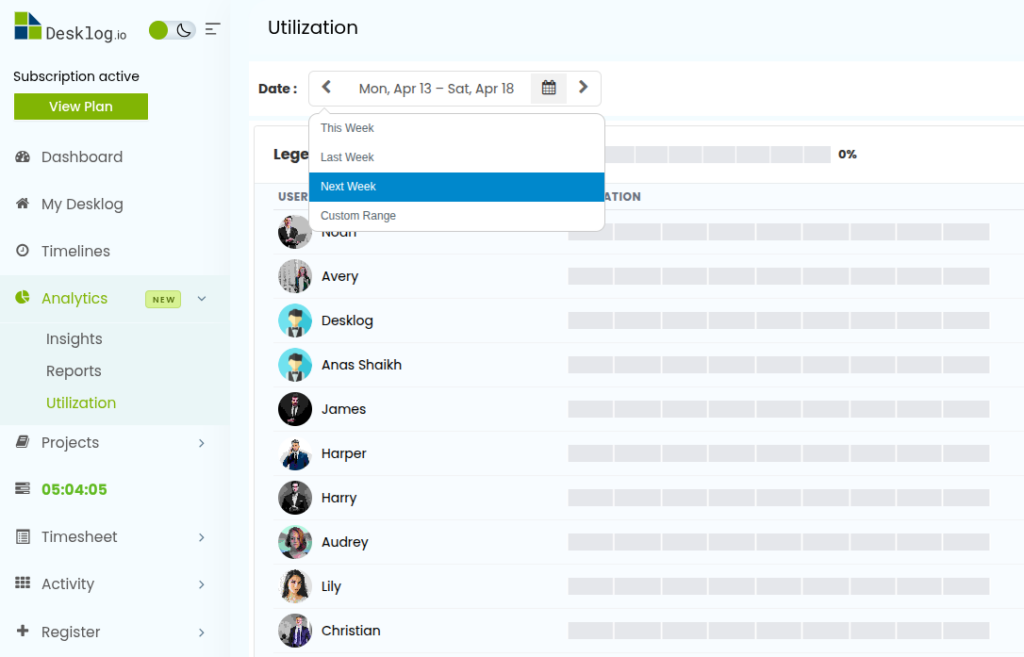
1. Date Selection
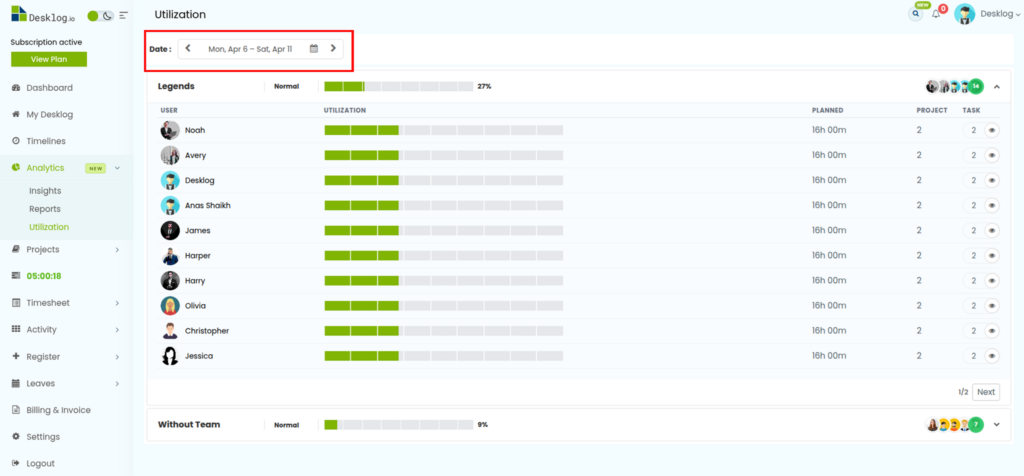
At the top of the page, use the date navigation to:
- View weekly data
- Select a custom date range
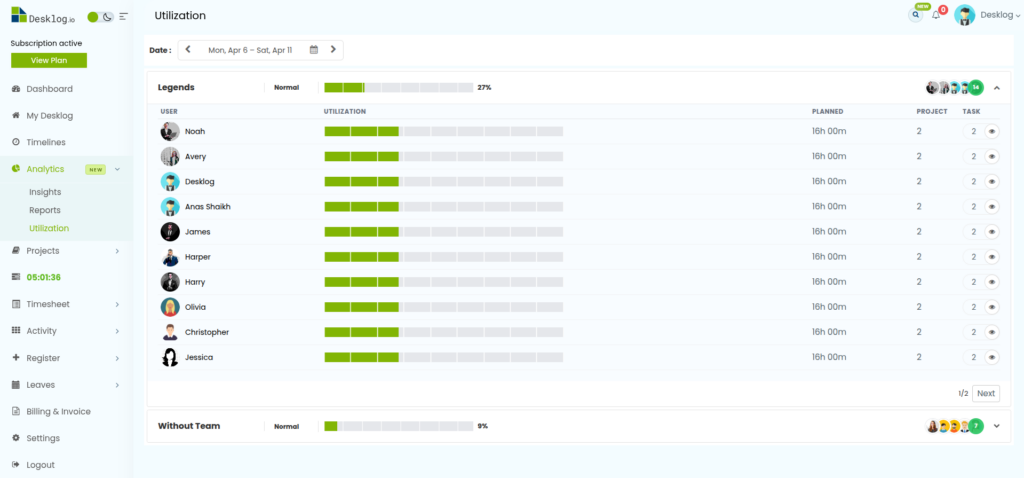
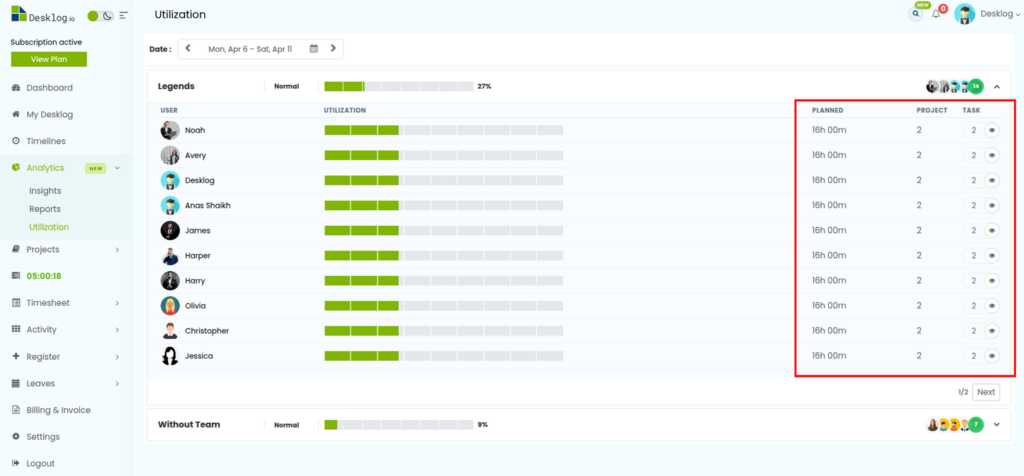
2. Team Utilization Overview
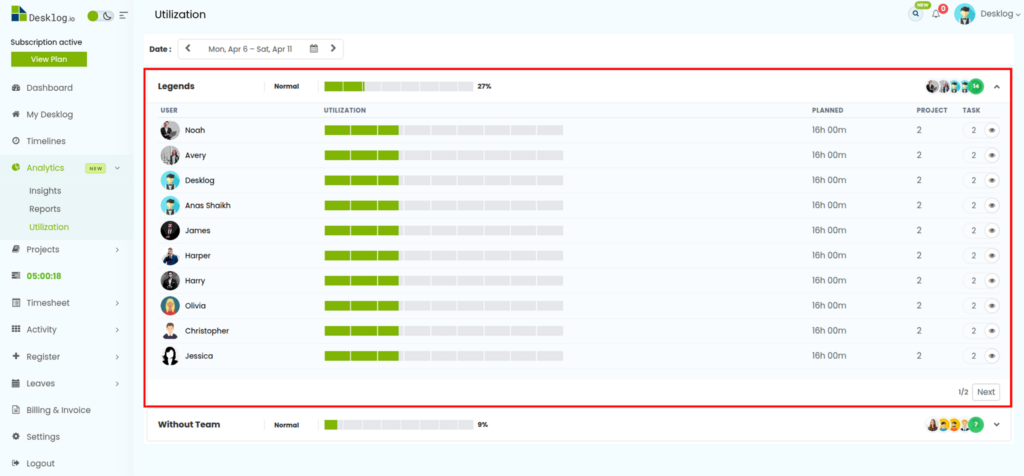
- The top section displays:
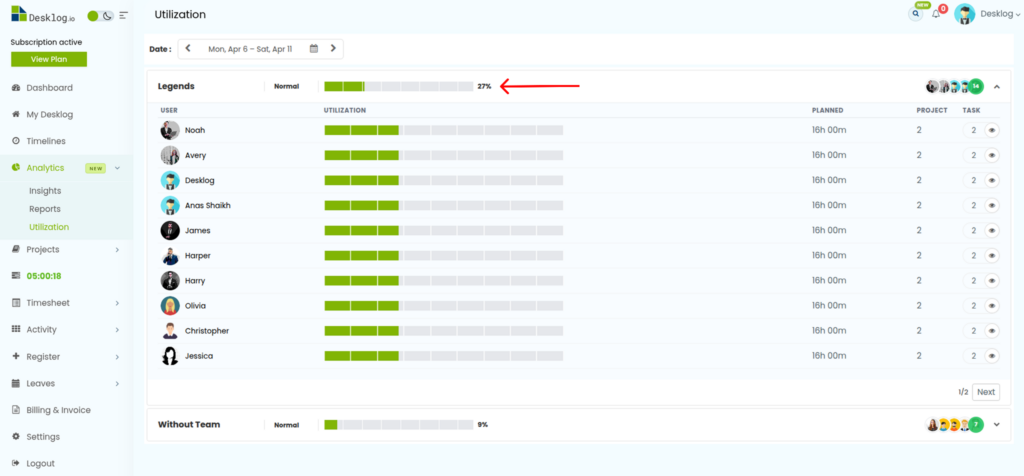
- Overall team utilization percentage
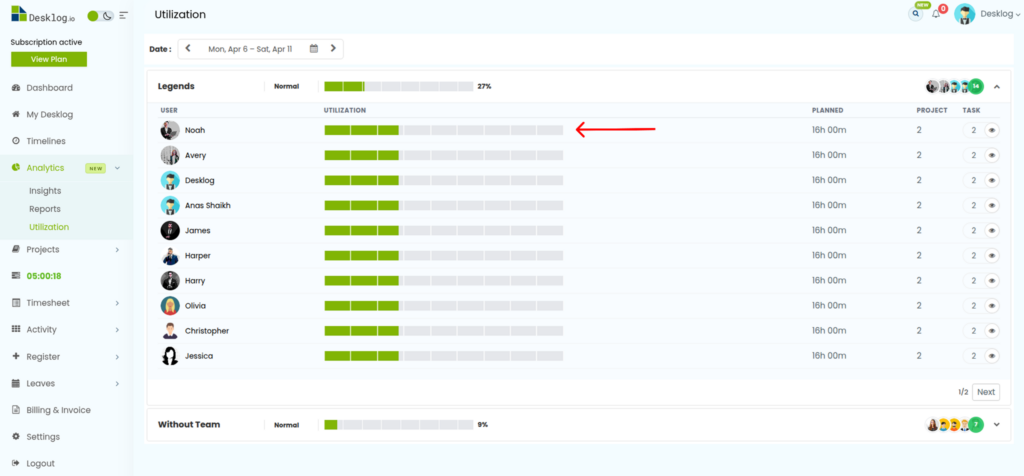
3. Individual Utilization
- Below the overview, you can see each team member’s utilization.
4. Work Details
For each user, you can view:
- Planned Time (total assigned hours)
- Projects (number of active projects)
- Tasks (number of assigned tasks)
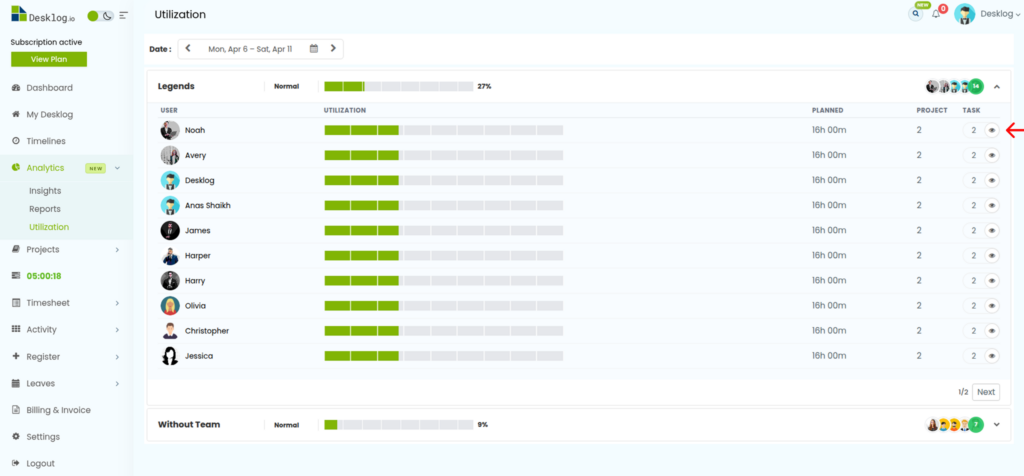
5. Viewing Task Details
- Click the view (eye) icon next to the task count.
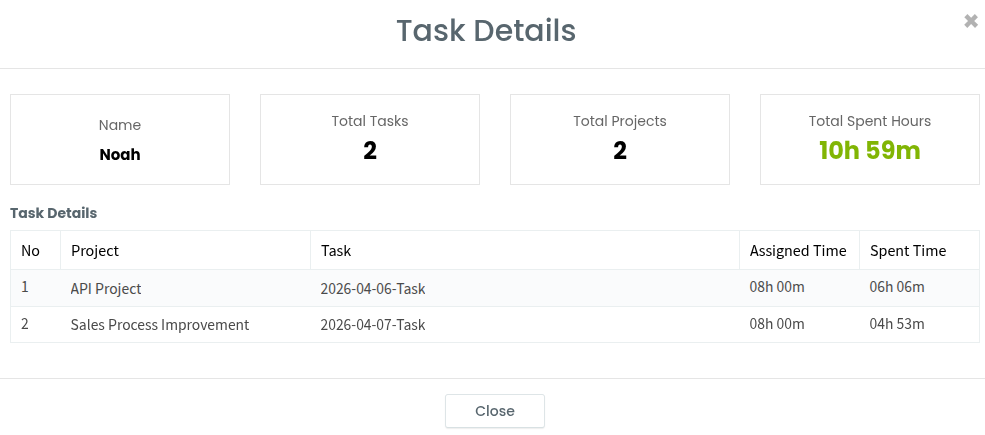
A detailed view will open showing:
- User Name
- Total Tasks
- Total Projects
- Total Spent Hours
- Task Breakdown, including:
- Project name
- Task name
- Assigned time
- Spent time
Key Benefits of the Utilization Page
- Track employee productivity in real time
- Compare planned vs actual work hours
- Identify underutilized or overutilized team members
- Gain insights for better workload planning