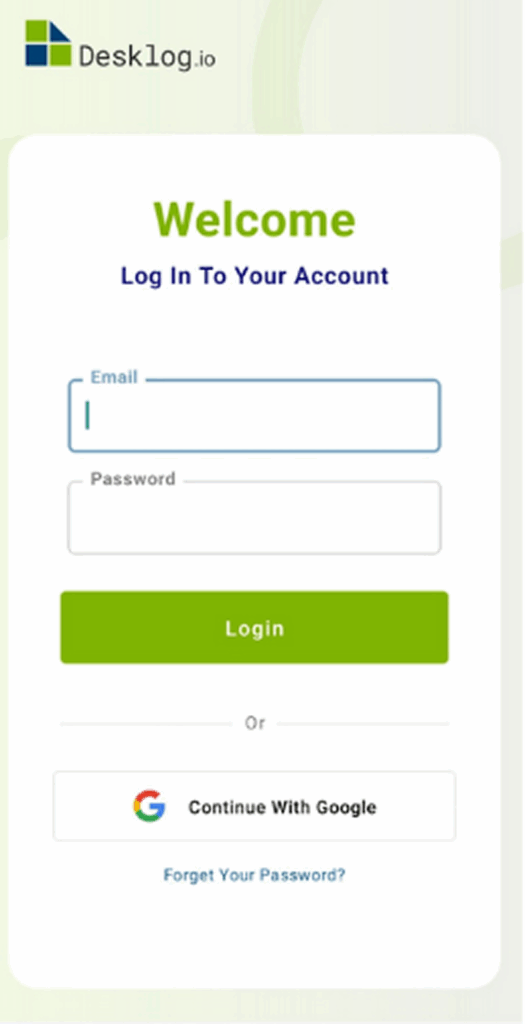
Download Desklog from Play Store or App Store.
You can log in to Desklog using Your Username and Password.
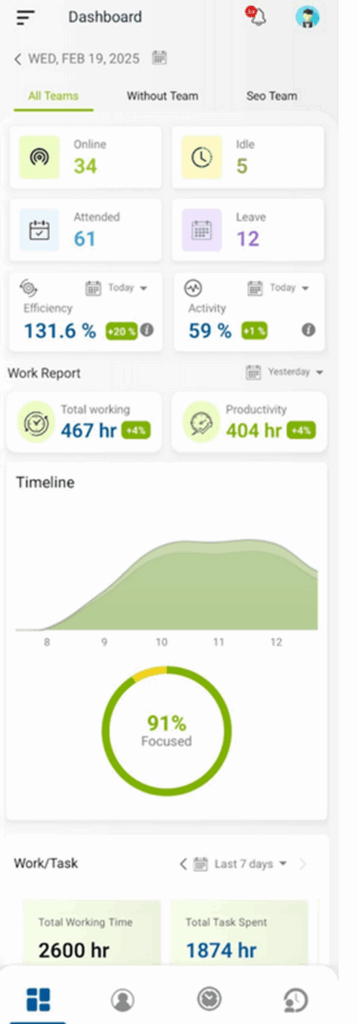
DASHBOARD
You’ll be redirected to the Dashboard, where you can view an overview of the entire team, including the number of members who are online, idle, and the team’s overall efficiency rate and activity percentage.
You’ll also see the work report, which includes Total Working and Productivity Hours, along with a graphical timeline view. Finally, you can check the total time spent over the last 7 working days.
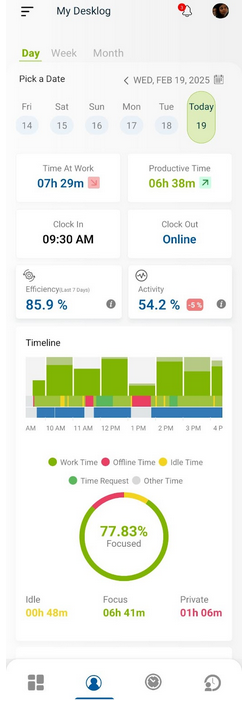
MY DESKLOG
Clicking on the Image Icon will redirect you to “MY DESKLOG,” where you can access your personal data, including Time at Work, Productive Time, Clock In/Out details, Efficiency Rates, and Activity Percentage. Additionally, you’ll see a visual timeline featuring a graph that tracks your Idle, Focus, and Private Time.
When you scroll down, you can view the Task Timesheet, which includes both completed and unfinished tasks, along with the timeline.
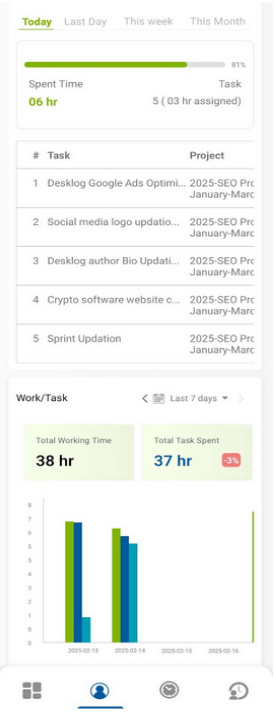
You can view your task and project details in a list format, followed by a graphical view that compares total working time with the time spent on each task.
TIMELINE
When you choose the timeline option, you can view the status of your employees, including data on the number of users who are online, idle, and offline.
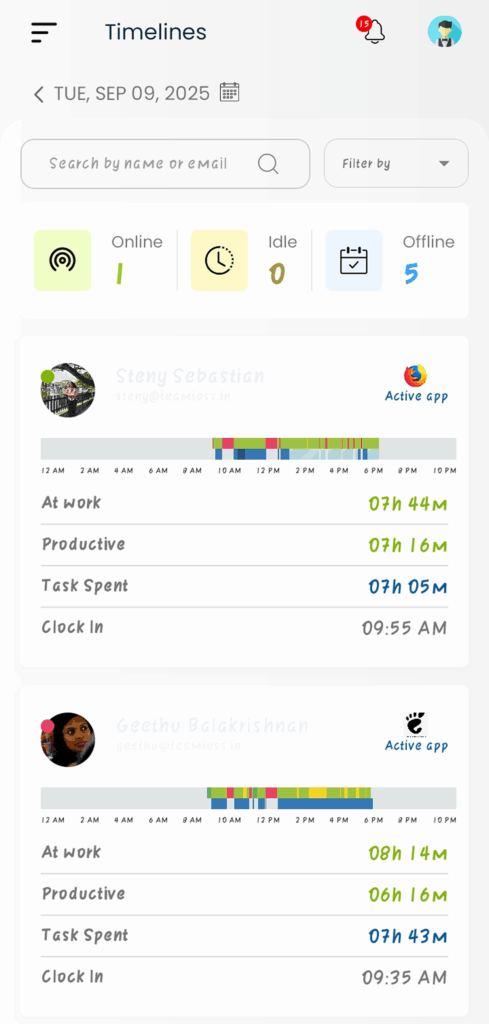
How To View A Particular User Data?
In order to view a particular user’s data click on a user that you need to check, you’ll be directed to a page where you can find the following data.
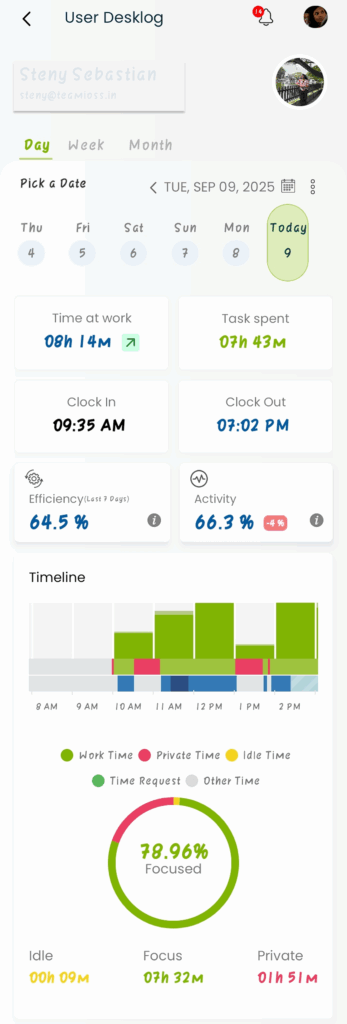
The ‘User Desklog’ provides data on metrics such as time at work, productive time, clock-in/out details, efficiency rates, and activity percentages. Additionally, you’ll find a visual timeline with a graph that tracks your idle, focus, and private time.
PROJECT LIST
In order to access the project list, select Projects from the menu bar. Then click on the Project List.
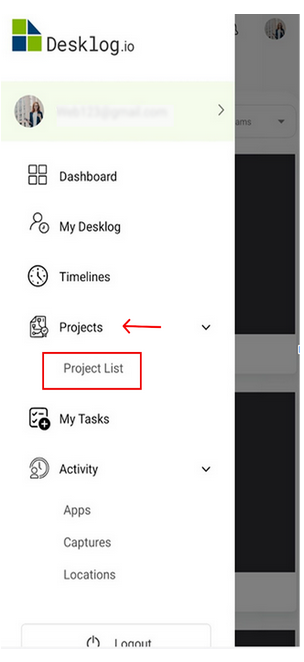
Clicking on the “Project List” will redirect you to a page where you can view the entire project list, including time spent, access status, client details, and assignee information.
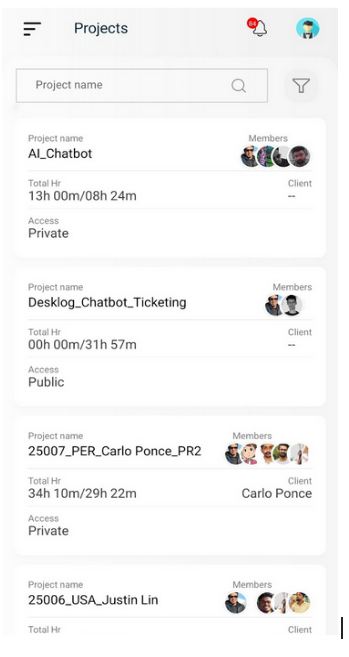
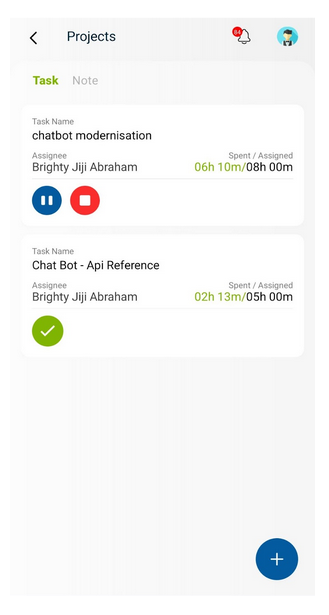
Select a particular project in order to find the Tasks under that project.
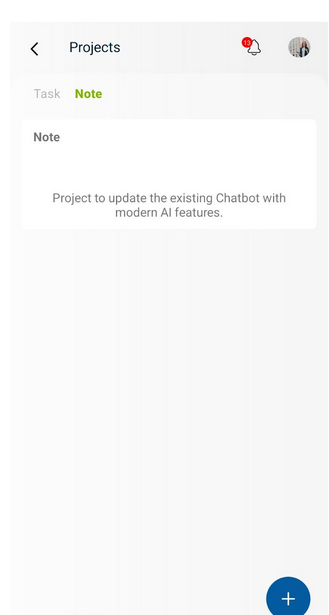
Select “Note” to add a description for the task. Simply enter your description and click the ‘Enter’ button to successfully add the note.
ACTIVITY
The “Activity” option, as the name implies, provides detailed data on user activities.
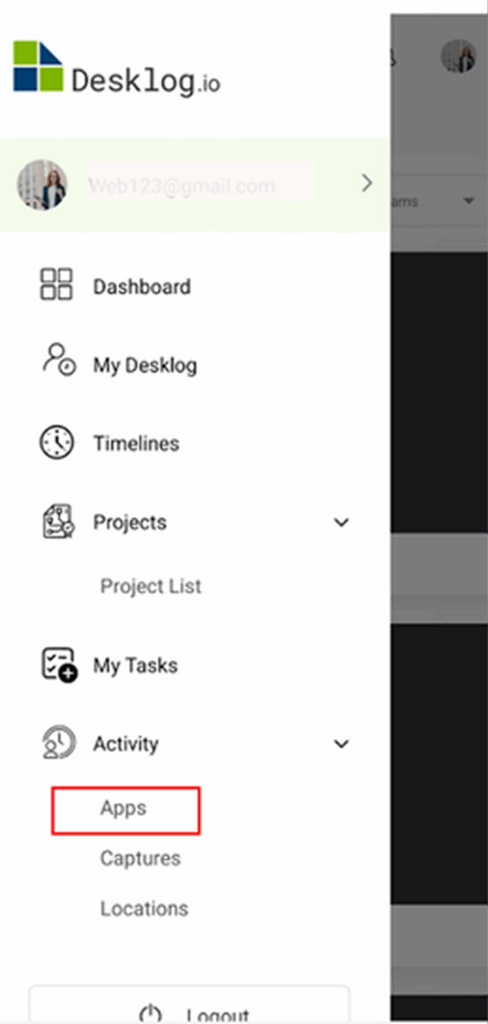
To access more options for Activity tracking, simply go to the menu bar, where you’ll find three options: Apps, Captures, and Location.
Apps
The “Apps” option allows you to view the total Activity Percentage, along with key metrics like productivity rate and efficiency rate.
A productivity graph will be available, distinguishing between Productive, Non-Productive, and Neutral app usage times.
Here, you will find the app usage percentages presented individually, offering insights into each category.
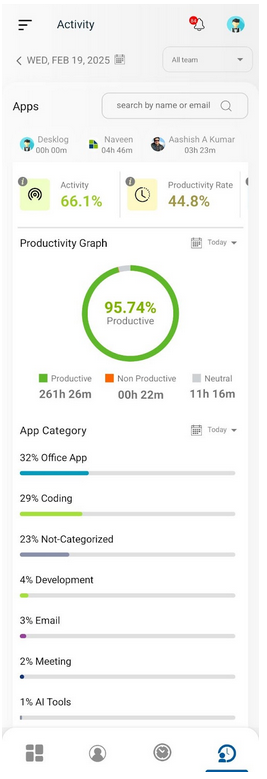
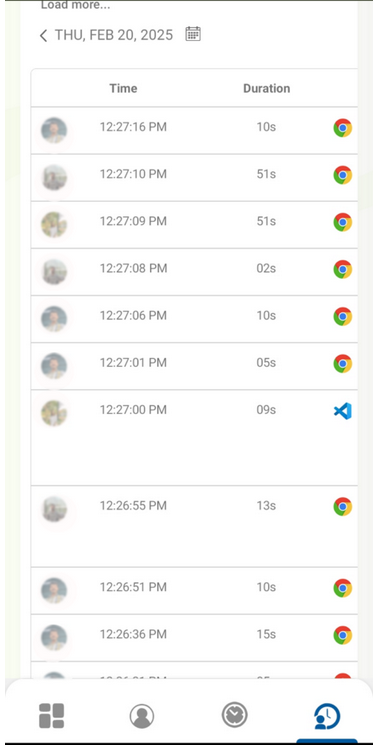
Following that, a list will be provided that includes details for each user, such as the time, duration, and the specific app they used during that time period. This allows for a clear view of individual user activity and app usage patterns.
Captures
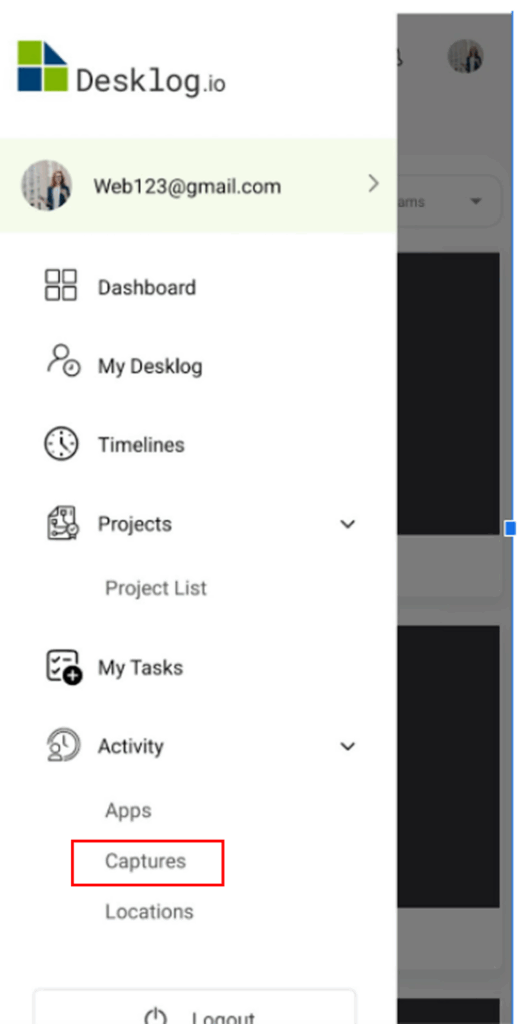
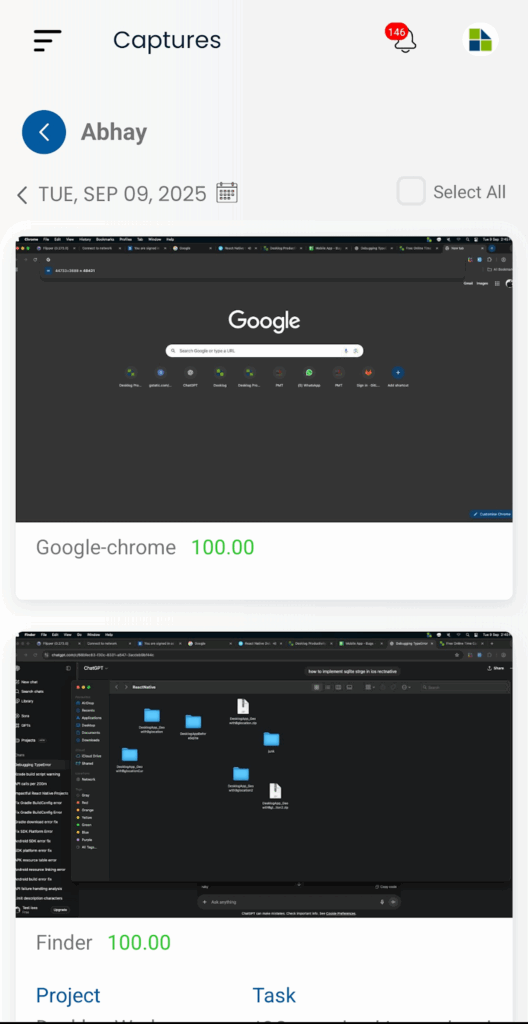
When you select the “Captures” option, you’ll be able to view screenshots of the apps that your users have used.
You can filter users using the search options and review their screenshots, and plus, each screenshot contains the data of the project and task they are doing at the same time the screenshot has been taken.
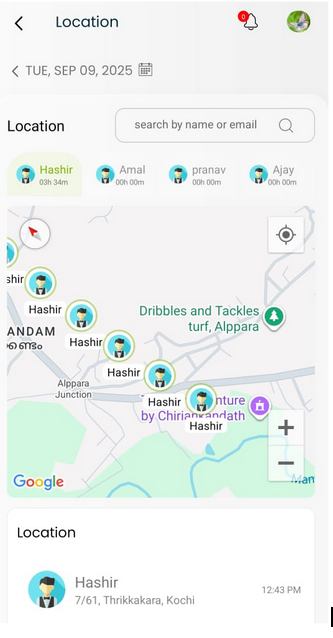
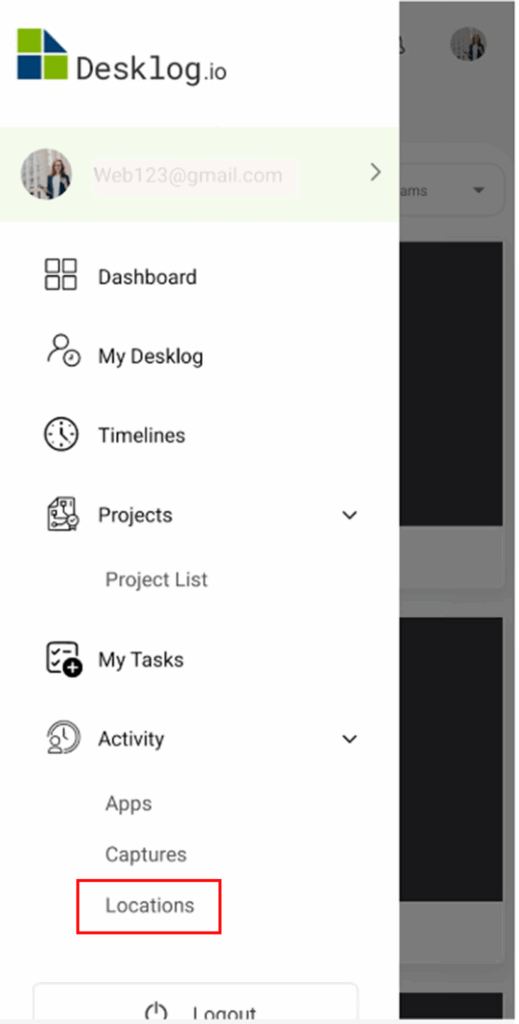
Locations
The “Location” option provides the location data of the users working under you, whether they are in the office or working remotely.
You can choose specific users from there and review their locations.