1. How does Desklog Work?
Once the users are added to the Desklog account, they will receive the invitation with credentials to log in to Desklog. The user can login to desklog account using these credentials. Once the users are logged into Desklog, the admins can view the tracked insights from the dashboard.
The users can login to Desklog by following these steps:
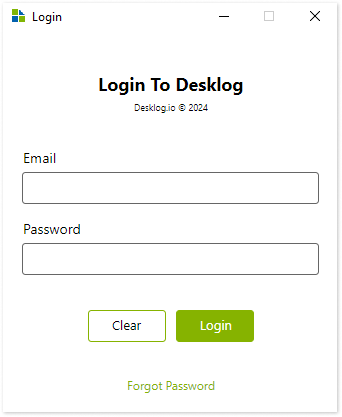
Click on the installed Desklog client app from your device. Enter the credentials you received and then click on the ‘Login’ button.
And you will get a pop up which says – ‘Login successful, App has started’.
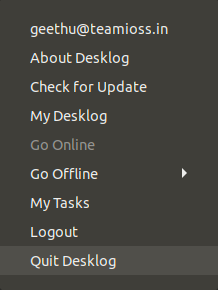
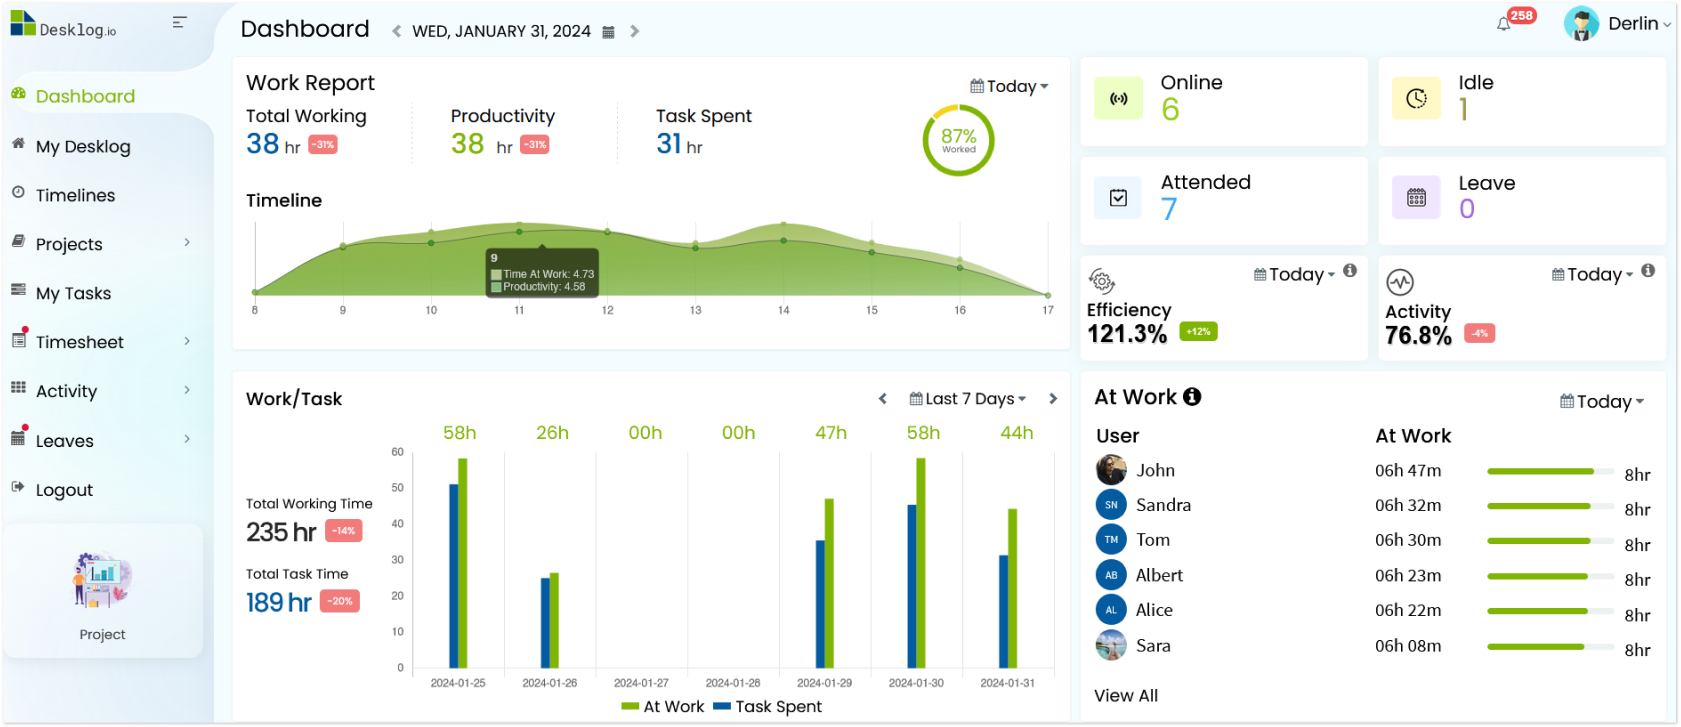
If the app has installed successfully, you’ll see a Desklog icon. Click on the same where you will see a list of options. Click on ‘My Desklog’ and you will be directed to the admin dashboard. This dashboard gives you the complete details of the tracked data by Desklog.
1. What information does Desklog keep track of?
You will be able to view the following details in Desklog dashboard:
2. What is the Difference Between Time At Work and Productive Time?
The total amount of time spent by the user in the workplace is called the Time At Work, encompassing productive, and non-productive time.
Productive time is the time a user spent in front of the system doing tasks and focused on work. In Desklog, the work hours excluding idle time is called the productive time.
What details does the Desklog User Dashboard have?
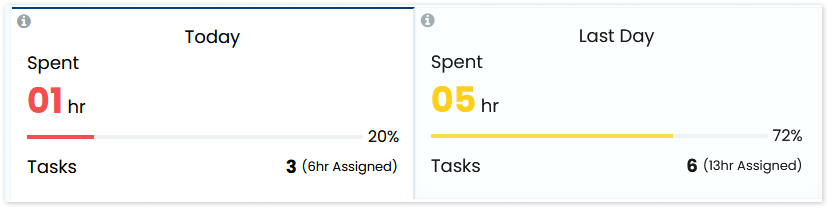
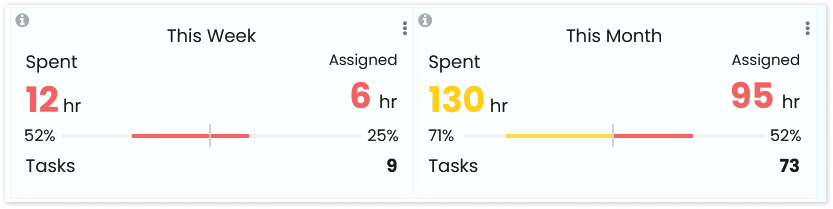
3. Task Overview
This part gives you insights on the time spent on tasks on a daily, weekly, monthly basis. You will get detailed task insights such as total time assigned, total time spent, and number of tasks done. You can also view the task report for last week and last month.
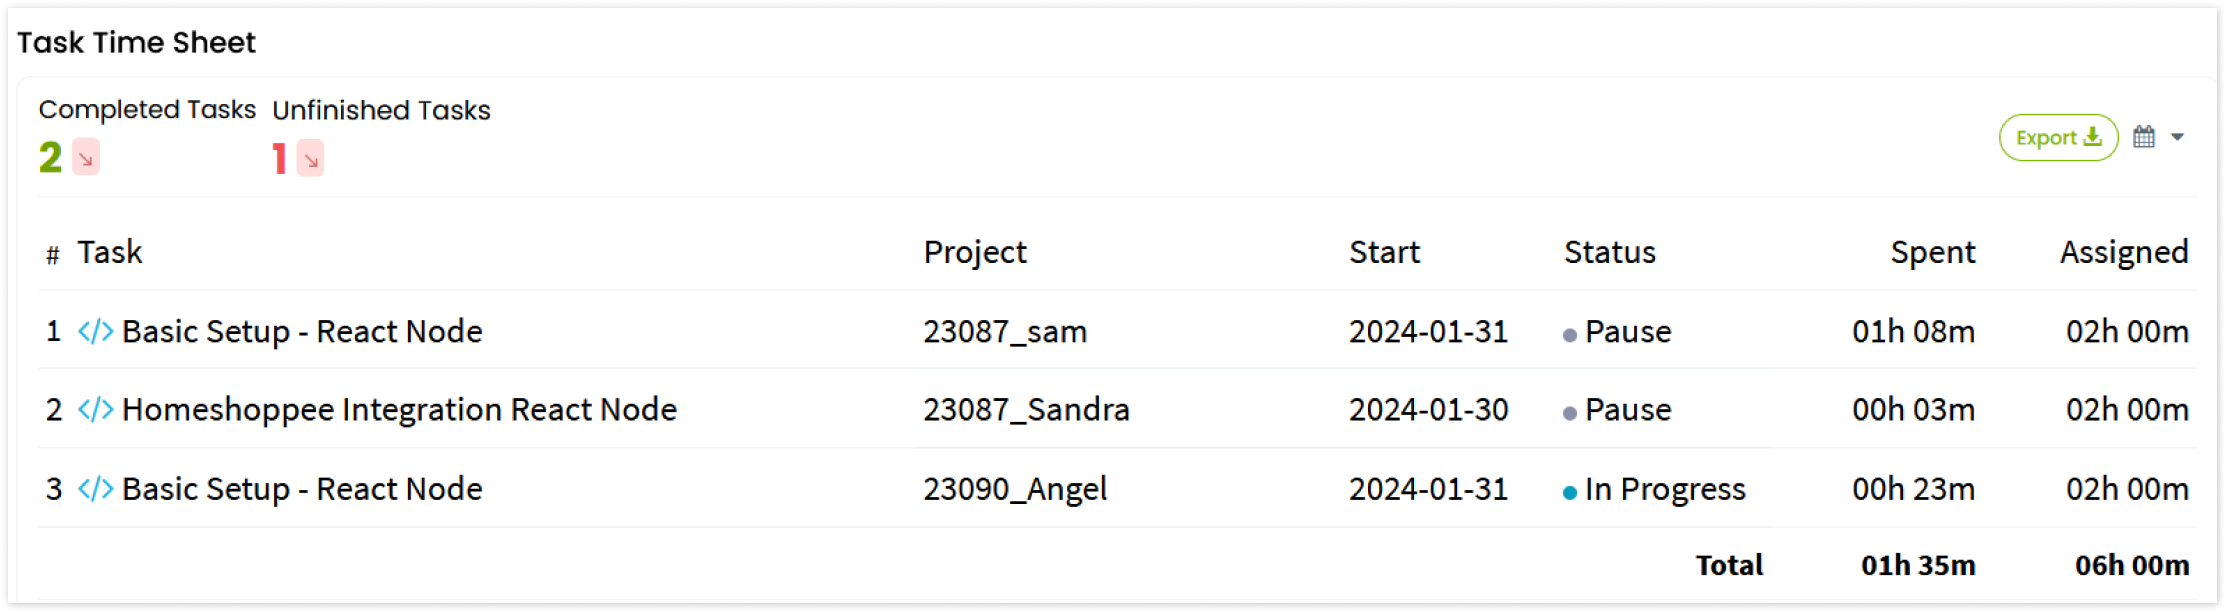
4. Task Timesheet
This includes task details like completed tasks, unfinished tasks, tasks name, project name, start date, status, spent time, and assigned time.
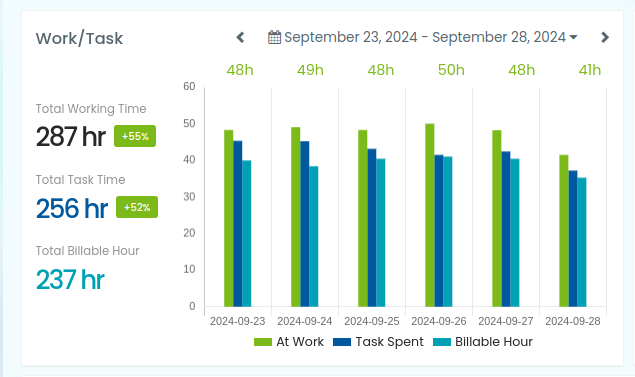
5. Work/Time Graph
This section shows a bar graph representation of work time & task time. You can get a task report of the last 7 days, Current week, last week, and custom range.
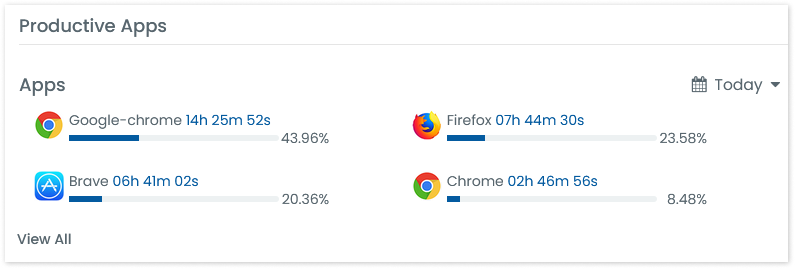
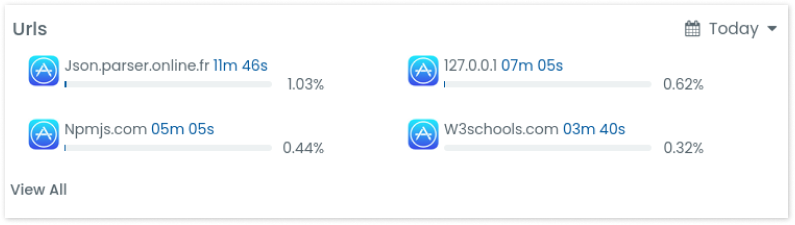
6. Productive Apps and URLs
7. And you’ve got several menus on the left side, where you can configure and analyze your users in the most accurate way.