Productivity Tracking at Admin Side
Dashboard
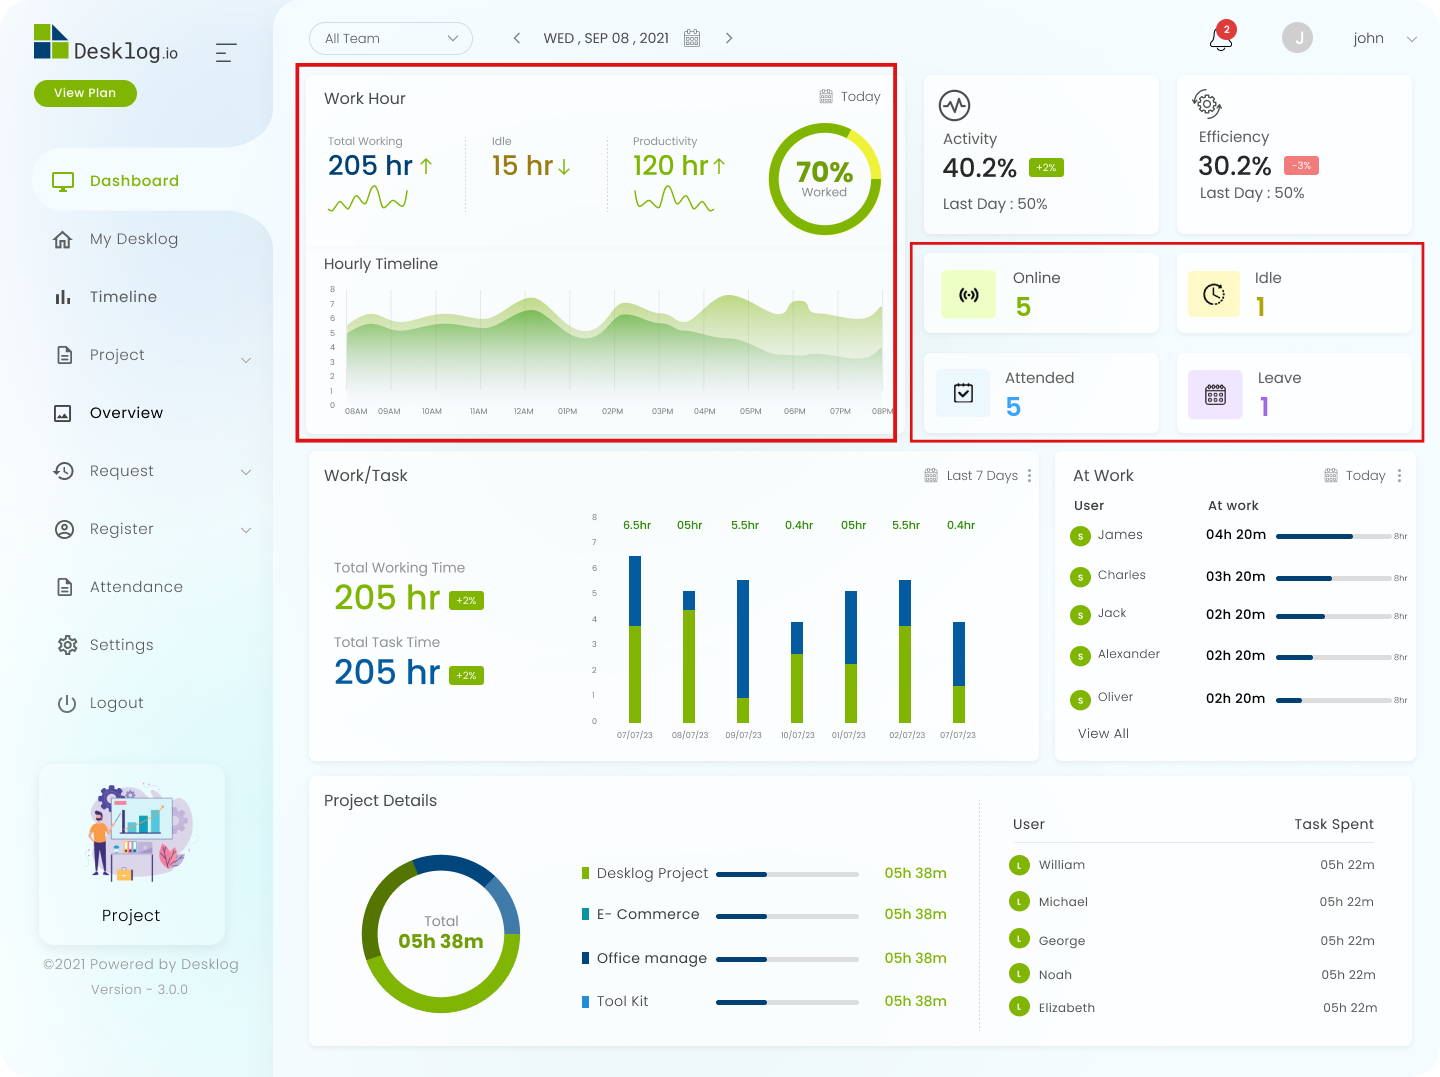
On Dashboard menu on the left panel, Admin will be able to view the following details as shown in the below screenshot.

Leave: The number of employees on leave.
Attended: The number of employees attended.
Online: The number of employees available online.
Work Report: A pie chart representing worked time and idle time.
Productivity Graph: The Productivity Graph shows the combined graph of productive, neutral, non-productive time spent by all the users during hourly time intervals.
Efficiency Tracker: Efficiency is measured by comparing the amount of productive time to the total time at work.
Activity Tracker: Activity is the percentage of keyboard and mouse strokes during the total tracked time.
The list of employees who fall under the following categories is displayed.
- Most Productive
- Most Unproductive
- Most Effective
- Most Offline Time Logged
- Late
- Absence
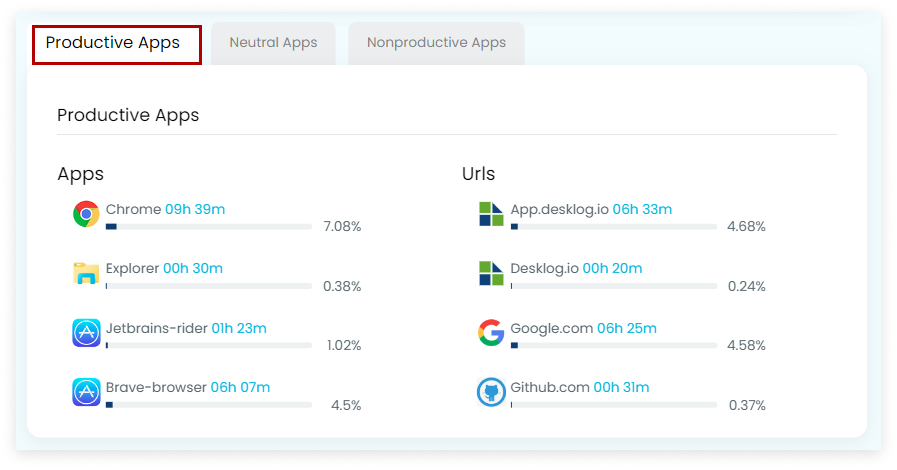
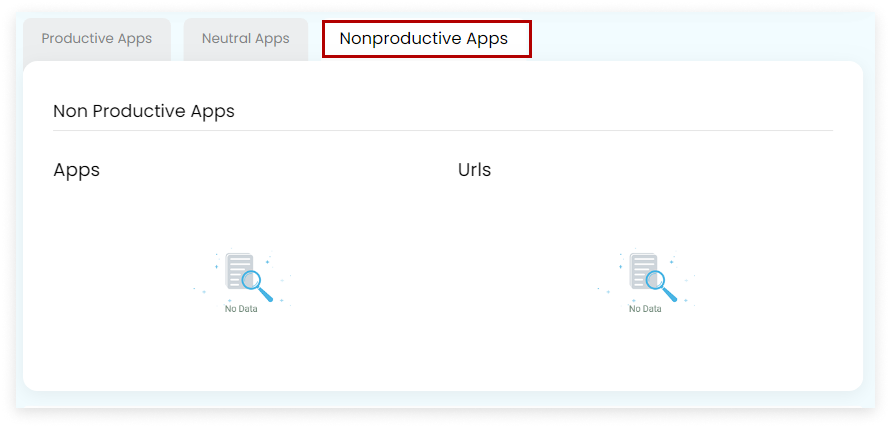
The list of apps which fall under the following categories is displayed
- Productive apps
- Neutral apps
- Nonproductive apps


